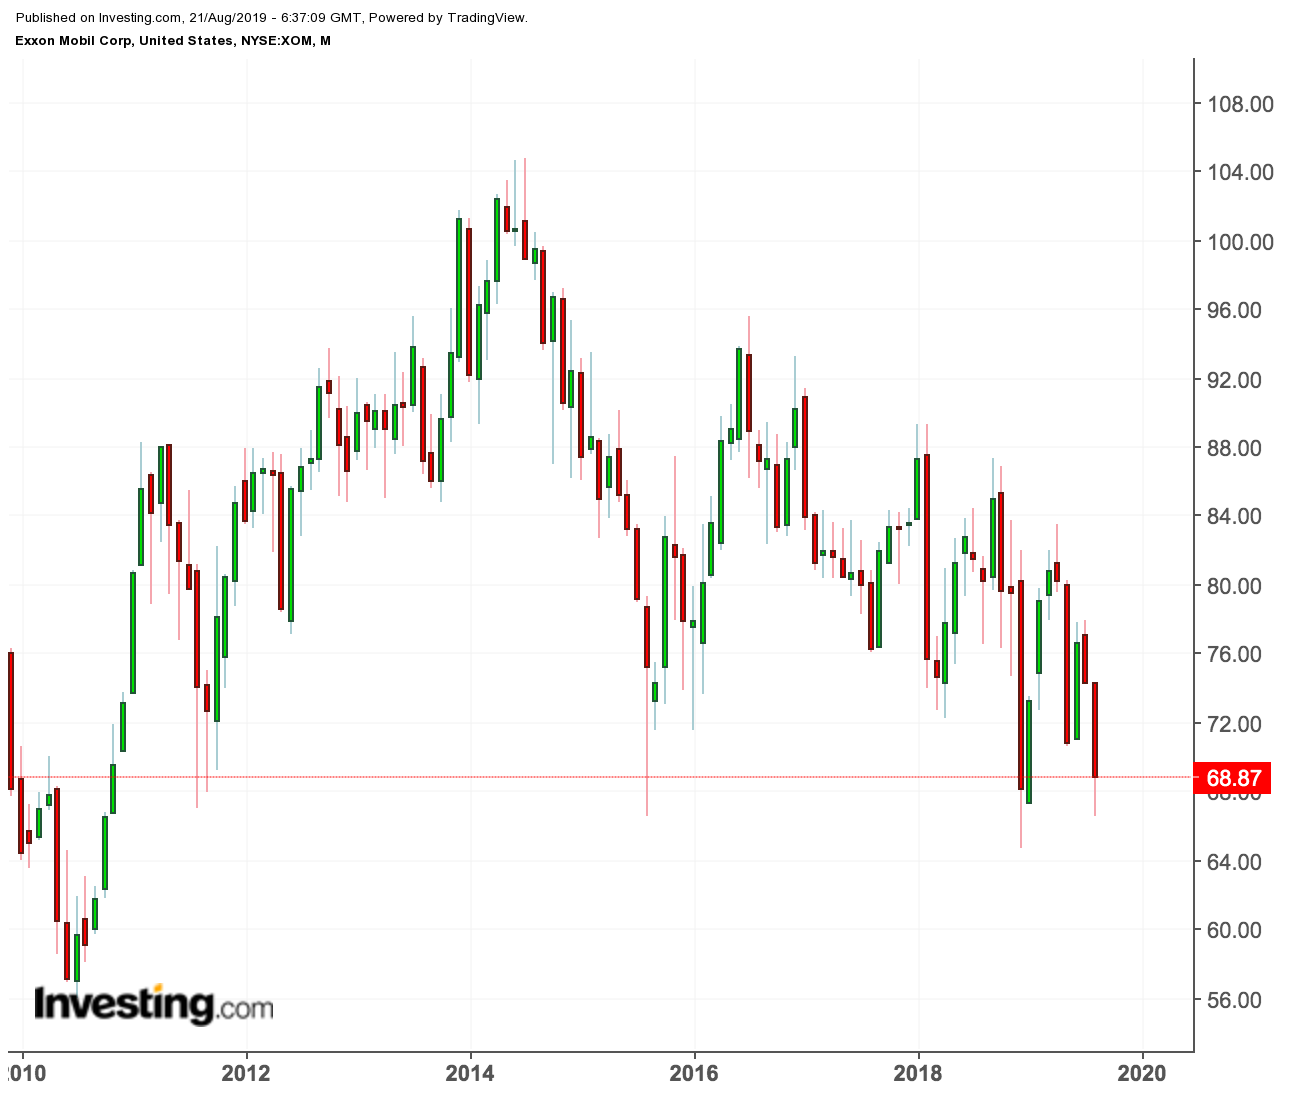
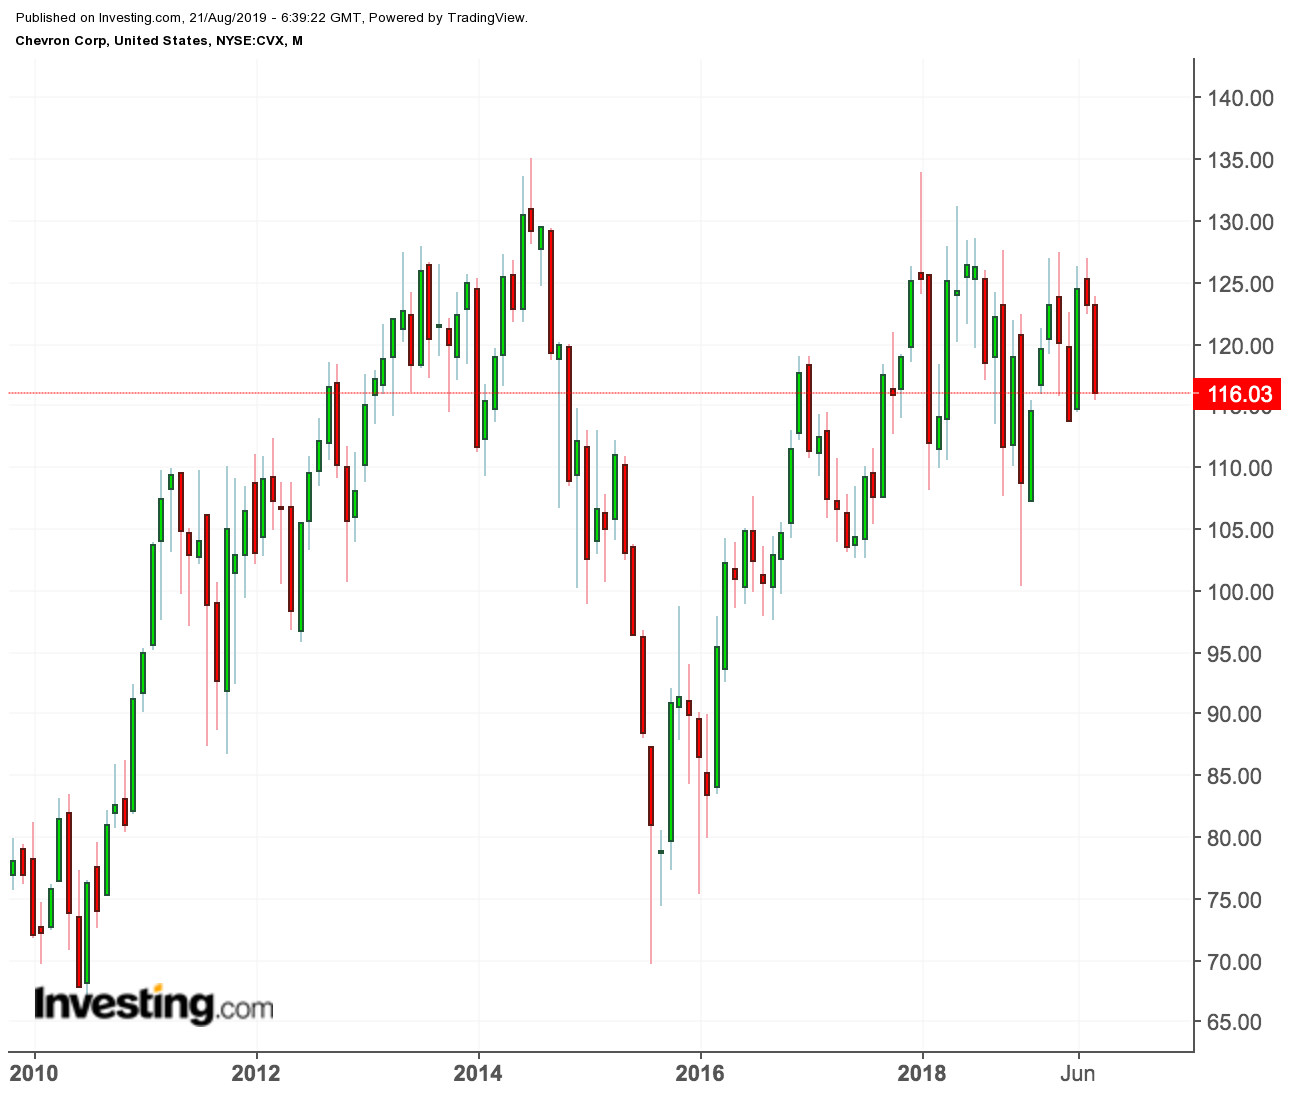
In a volatile energy market, it doesn’t take much for the oil majors to lose their shine. ExxonMobil (NYSE:XOM), after surging 22% until late April, has lost almost all its gains for the year. The same goes for its closest rival, Chevron (NYSE:CVX).
The ongoing trade war between the U.S. and China has much to blame for their poor performance, a tussle which slowed demand and threatened to worsen the supply glut.
Amid this weak demand outlook, the SPDR S&P Oil & Gas Exploration & Production (NYSE:XOP) fell to its lowest level during the past decade. While that drag is unlikely to lift anytime soon, given the slow pace of negotiations and the uncertainties involved, this could also be the right time to pick your winner from the trade war.
Oil majors, with their bigger balance sheets and diversified business models, do better than their smaller peers in times of distress. For that reason, let’s focus on the two largest U.S. producers — Exxon and Chevron — to see which “super major” could prove a better bet in this environment.
1. ExxonMobil
Among U.S. oil and gas super majors, Exxon is the least-loved by analysts and investors. Its shares have generally underperformed in both short- and long-term rallies over the past five years as its output declined and the company lacked direction.
The company’s latest reports suggest that its earnings have become more volatile than peers. In the first quarter, it was the poor performance in its refining business that pushed profitability lower, while in the second quarter it was its chemical unit where profits collapsed by almost 80% compared to the same quarter in 2018.
Exxon characterized this as a temporary problem of excess capacity. The oil giant’s upstream business didn’t do well either; earnings were essentially flat if you take out the tax benefits when compared with the first quarter.
But with these setbacks, it’s also a reality that Exxon isn’t just sitting still. The world's largest publicly traded oil producer has taken a long-term approach to improve its growth outlook.
The company is spending massively to increase its oil production in the U.S. Permian Basin five-fold, plus start 25 projects worldwide.These investments are forecast to add more than 1 million oil-equivalent barrels per day to the company's production volume.
If all this materializes, and the price of oil remains around $60 a barrel, Exxon’s management expects the company will be able to double earnings by 2025. Exxon pays $0.87 a share quarterly dividend which translates into a 4.9% annual dividend yield.
2. Chevron
While Exxon is spending big to increase its output, Chevron has taken a different approach. The company is keeping its spending low and trying to squeeze more juice from existing assets. According to management, it intends to maintain low levels of capital spending ($18 billion to $20 billion annually) from 2018 to 2020.
Chevron estimates it will grow production by 4-7% annually between 2017 and 2020. Indeed, it appears the company’s short-term plan is working. In the second-quarter, it posted strong production growth from the Permian Basin combined with a stabilization in its refining operations.
The producer has been the top performer among the five so-called supermajor oil producers this year, after walking away from a bidding war for Anadarko Petroleum (NYSE:APC), which Occidental Petroleum (NYSE:OXY) agreed to buy for $38 billion. That decision awarded Chevron a breakup fee that helped the company to hike its share buyback 25%.
Chevron will get most of its production growth from the Permian Basin and is planning a giant expansion at Tengiz in Kazakhstan, but analysts have questioned whether the company has a large enough portfolio to sustain growth beyond 2023.
The company pays $1.19 a share quarterly dividend that gives a 3.99% annual yield. But if you throw in the benefit of the share buyback plan that Chevron is undertaking, investors will get another 2% in terms of trailing free cash flow yield.
Bottom Line
By comparing the two oil majors’ stock performance, it’s not difficult to conclude that investors are liking Chevron over Exxon. Since Darren Woods became the CEO of Exxon in 2017, shares has fallen 22%, closing yesterday at $69.03, compared with almost no loss for its biggest American rival, Chevron, which yesterday closed at $116.16.
That said, both companies are great dividend stocks with a solid income appeal for long-term investors. If you’re a long-term investor and want to have some exposure to oil stocks, both Exxon and Chevron would be a bet worth taking, despite their different paths to achieving growth. Each has a rock-solid balance-sheet and low-level of long-term debt to provide strength if the economy is entering a slow patch again.
