It is challenging to find stocks that pay enough money to retire on. For example, even a 3.3% dividend—generous by today’s standards—isn’t enough to turn a $1,000,000 into an income stream that will last forever.
I’ll save you the math. It’s just $33,000 per year on a million dollars.
Fortunately, this same dividend yield is understated on most mainstream financial websites. In reality, this stock paid 7.7% over the past twelve months. Which means its millionaire investors actually earned $77,000 in dividend income.
Yes, you read that right. There was an extra $44,000 hidden in plain sight thanks to a “special” dividend payment.
Three Kinds of Special Dividends
Most investors are familiar with “regular dividends,” which are simply recurring cash payouts doled out regularly—once or twice a year, typically quarterly, or when we’re lucky, monthly.
A special dividend, by comparison, is a one-time, typically non-recurring payout. Sometimes companies pay these in addition to their regular dividends. Sometimes, companies with no regular dividend will nonetheless throw out a special payment.
Why? There are three reasons.
Special Dividend #1: We Had a Great Quarter (or Year)!
Every now and then, a company will report out-of-this-world profits, and they decide to share the excess wealth with shareholders.
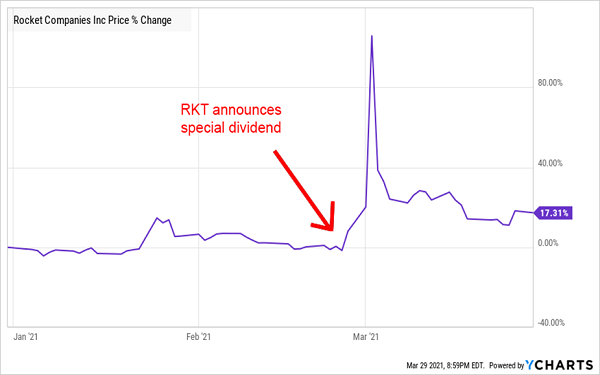
Such was the case with Rocket Companies (NYSE:RKT), which in late February announced a $1.11 per share special dividend (a 5.6% annual yield on its price at the time).
It did so after a blowout Q4 report, earning $1.14 per share against estimates of 87 cents. Those profits were 350% higher year-over-year, and came on the back of a 144% jump in revenues that also easily beat expectations.
OK. You and I see Street-smashing reports all the time, and rarely does a company announce a big one-time payout. Sometimes other motives can be at play—in Rocket’s case, it was facing extremely high short interest at the time. What better way to shake a few of those shorts loose than to throw cash at shareholders?
Of Course, It Didn’t Last Forever

Special Dividend #2: We Jettisoned Part of the Company!
Another, more common, reason for a company to announce a special dividend is a one-time influx of cash from selling off a part of itself.
Several of these deals will pop up every year. Most recently, Barrick Gold (NYSE:GOLD) said it was proposing a 42-cent-per-share special dividend to shareholders, financed by the proceeds from several deals, including the late 2019 divestiture of Kalgoorlie Consolidated Gold Mines. The proposal will be voted on in May; the special dividend would represent a 2.1% annual yield, which more than doubles the 1.8% yield shareholders are getting from Barrick’s regular payout.
Special Dividend #3: The Regular Special Dividend
Remember what I said earlier about foreign companies’ dividends? They pay out dividends as their profits allow, resulting in completely unpredictable income. Here in the U.S., dividends are much more reliable, but they’re also far less flexible—so if a company’s financial situation sours, they’re forced to make a drastic cut, or even suspend the dividend outright.
But a handful of stocks use special dividends to create a “hybrid” dividend program—one where they offer a certain base level of regular dividends, then “top up” the payout regularly via these special dividends as profits allow.
It’s these very companies that have “hidden yields.” That’s because most stock screeners won’t include these special dividends in their yield calculations. Thus, scattered throughout the market are a bunch of seemingly mild-mannered yields that frequently become superpowered but go under the radar.
Let’s dig in. Here are three special dividend payers whose yields are more than they seem.
1. CNA Financial
- Stated Dividend Yield: 3.3%
- Actual Dividend Yield: 7.7%
Recently, we highlighted a number of dividend-raising stocks that earned a thumbs-up from the DIVCON rating system. Among them, CNA Financial (NYSE:CNA), one of the 10 largest commercial insurers in the U.S. It’s also a subsidiary of Loews Corporation (NYSE:L), which owns some 90% of its shares.
As far as insurers go, CNA has a lot to like. Revenues have been steadily growing for years without missing a beat. The bottom line has been more spotty—annual net income has fluctuated anywhere from $479 million to $1 billion over the past six years—but that’s typical for an insurer. And very recently, CNA was hit by a major cybersecurity attack, but so far, it appears the attack hasn’t made a dent in operations; AM Best, S&P Global Ratings and Fitch Ratings have all kept their ratings on CNA intact.
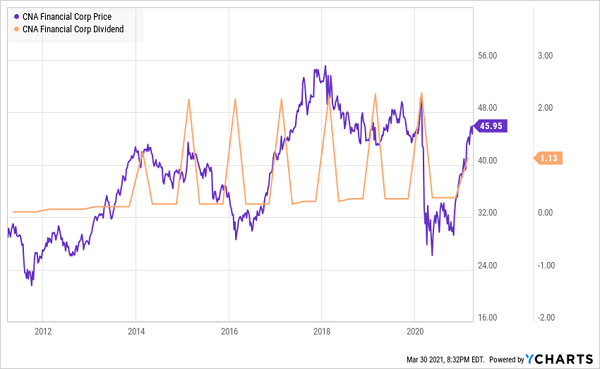
What’s more important is that CNA’s results have been strong enough to support not just a rising dividend—one that has jumped from 25 cents per share in 2017 to 38 cents per share as of this year’s first payout—but a regular special dividend for years.
That regular payout alone is a 3.3% yield. Toss in a 75-cent special dividend paid in March, and that gets boosted to 4.9%. That alone isn’t bad, but consider that the 75-cent “top-up” reflects last year’s difficult COVID environment. Typically (as in, for at least the past four years), that payout has been a cool $2 per share. If CNA returns to that kind of payout, we’re looking at a yield of 7.7%!
It’s a Choppy Way to Get Paid, But You DO Get Paid

But I’ll remind you of the core principle of investing in any insurer:
“Firms that write policies smartly … generate extra ‘float’ which they can invest each year. With long-term rates in the tank, these companies haven’t been able to earn much on their idle cash. But as interest rates rise, it will provide them with a nice catalyst for higher profits.”
The flip side is true, too: If interest rates chill, CNA likely will, too.
2. Nuveen Enhanced Municipal Value Fund
- Stated Dividend Yield: 4.3%
- Actual Dividend (Tax-Equivalent) Yield: 7.9%
The Nuveen Enhanced Municipal Value Closed Fund (NYSE:NEV) typically will invest at least 80% of its assets in municipal bonds that are either investment-grade, or that are unrated but judged by the manager to be of similar quality. The rest of the portfolio can buy up “junk” munis, with half of that allocation allowed to go into munis rated B- or worse.
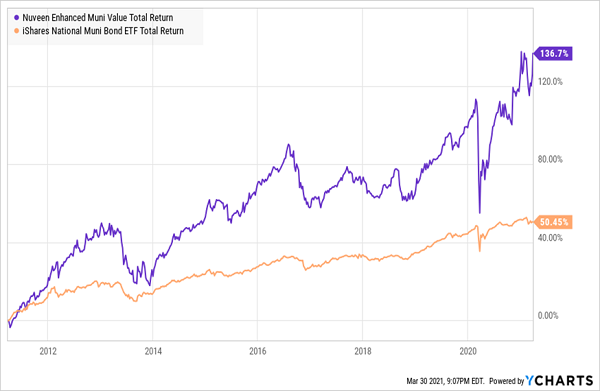
Nuveen uses quite a bit of leverage in this one, at about 35% of assets at the moment. So it’s going to be a bumpier ride than a bread-and-butter muni ETF. But thanks to deft management of that leverage and its flexible mandate, NEV has put its plain-Jane competition to shame.
A Chart That Will Get You Excited About Munis

And some of those returns are bolstered by special dividends.
Nuveen Enhanced Municipal Value currently yields 4.3%. Tack on its most recent special dividend, and that hikes the yield up to 5.0%. But sweetening the deal even further is that most of its distributions are tax-exempt in nature. If you’re sitting in the top tax bracket, that’s a tax-equivalent yield of 7.9%!
I’m sure you’re foaming at the mouth, but try to stay your hand for right now. NEV currently trades at a 7.2% premium, as opposed to the 3.8% discount it has averaged over the past five years.
3. Main Street Capital
- Dividend Yield: 6.3%
- Main Street Capital (NYSE:MAIN) is largely considered one of the best business development companies (BDC) in the biz.
Main Street provides debt and equity capital solutions to lower-middle-market companies, and debt financing (primarily floating-rate first lien senior secured debt) to middle-market firms. A single share of MAIN gives us exposure to 175 portfolio companies across literally dozens of industries, with no company representing 2.8% of total investment income, and no industry making up more than 6% of TII.
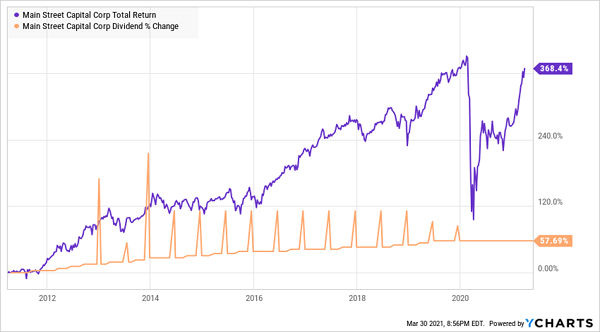
Distributable net investment income (DNII) has largely been on the upswing over the past decade, from $1.25 per share in 2010 to $2.66 per share in 2019—then, like most BDCs, business dropped off in 2020, with the company reporting $2.26 per share in DNII. Nonetheless, the steadily improving operational performance has allowed MAIN to keep upward pressure on its regular monthly dividend while also providing a pair of special dividends for years up until the pandemic.
Main Street Has Made a Habit of “Topping Up”

The pandemic is the perfect example of why these top-up dividends exist in the first place. Unlike other BDCs that had to cut into their regular payouts, Main Street’s conservative dividend program allowed them to simply shut off the special-dividend flow to conserve cash until brighter times returned.
When MAIN will resume its special dividends remains to be seen. But if Main Street resumed those payouts at the same rate as 2019, we’re looking at a boost in dividend income from 6.3% currently to 7.5%.
Not bad from one of the BDC space’s few blue chips.
Disclosure: Brett Owens and Michael Foster are contrarian income investors who look for undervalued stocks/funds across the U.S. markets. Click here to learn how to profit from their strategies in the latest report, "7 Great Dividend Growth Stocks for a Secure Retirement."
