Investing.com’s stocks of the week

What a joy it is for traders having Donald Trump as U.S. president as he delivers a never-ending source of volatility to the markets. It is a truly wonderful gift.
What is even more delightful is the short-termism of each and every tweet, as the market swoons before recovering. In many ways it is so predictable; it's what I refer to as the souffle effect. What goes up comes down just as fast and vice versa.
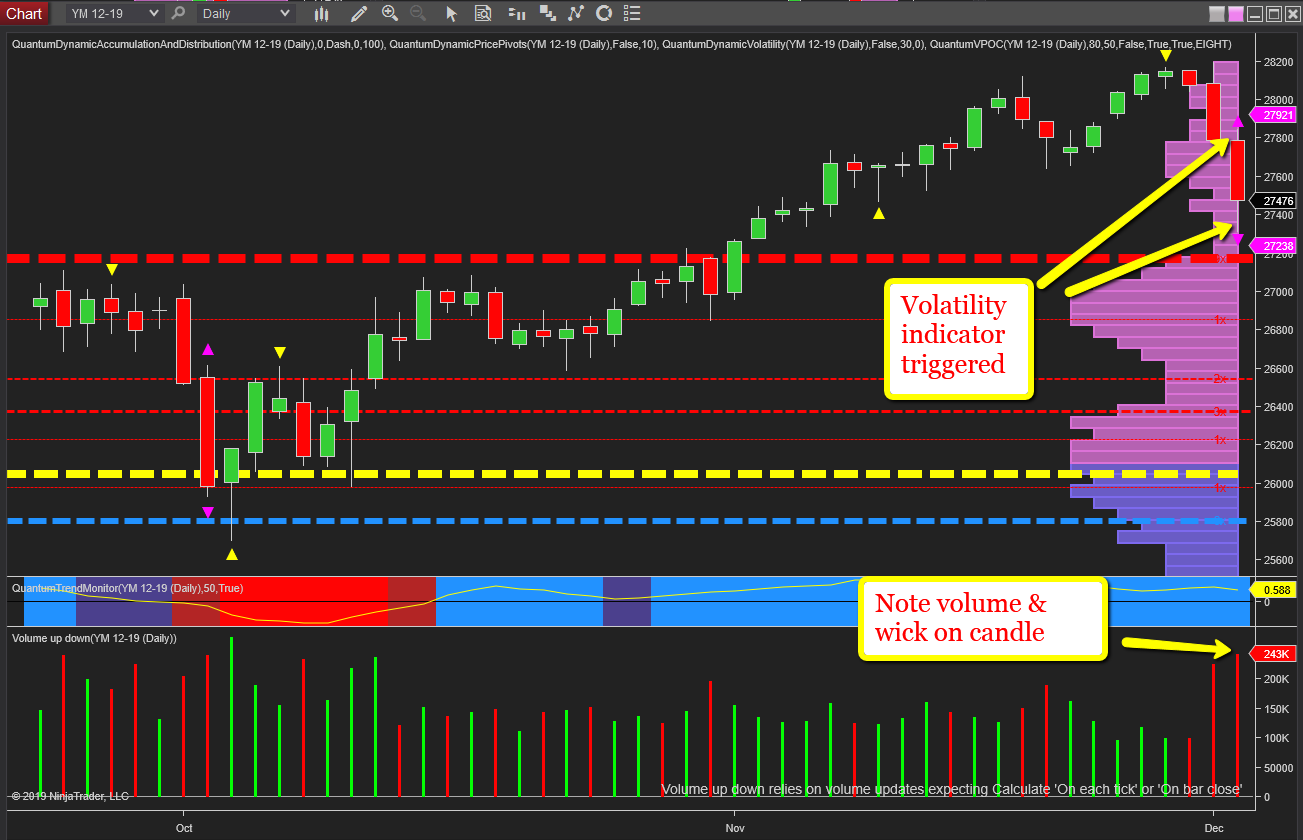
Indeed, this simple principle can be applied to the daily charts for all the U.S. indices. For my example, I have taken the YM emini, but both the ES and NQ mirror the effect perfectly. And, to cut to the chase, expect the markets to bounce back quickly from this short-term effect.
For the daily chart of the YM emini, this effect is clearly signaled in two different ways. First, consider yesterday's volume. It was extreme, but more importantly, the reversal has already begun with the heavy buying coming in late in the session, denoted with the deep wick to the lower body of the candle.
Second, the volatility indicator has been triggered which signals a move in price action outside the average true range, with the consequent expectation of either a partial or a full reversal as we expect the price action to trade back inside the spread of the candle.
Over the next few days, expect to see risk-on sentiment return, gold to fall, bond yields to rise and the Japanese yen to sell off as this short-term, knee jerk reaction is seen for what it is—an opportunity for the market makers to accumulate in a wave of panic selling.
