Scary! And I’m not referring to some of the costumes I saw on Halloween night.
What I am talking about is the price performance for stocks in the month of October.
- S&P 500 down 2.2%
- Dow down 3.1%
- Nasdaq off 4.4%
And in the wake of such underwhelming performance, here I am predicting that stocks are going to rally over the next two months (and beyond). Really?
Really!
Yesterday, I shared the first five reasons why. Today, it’s time for five more. So let’s get to it…
~ Bullish Factor #6: A November to Remember
I’m not talking about the election (yet). I’m talking about the historical performance of the stock market in the month of November.
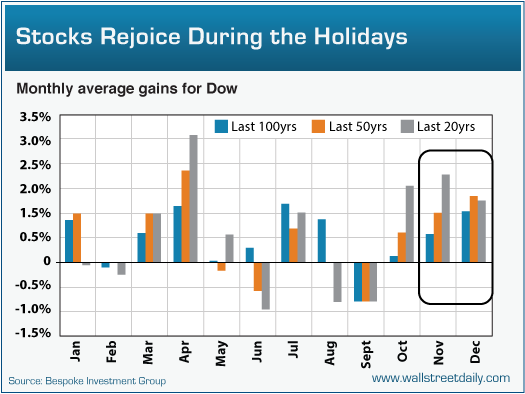
Next to April, November’s the best month of the year for stocks over the last 20 years.
The Dow puts up positive gains 70% of the time – with the average gain checking-in at 2.03%, according to Bespoke Investment Group. 
The performance over the last 50 years and 100 years isn’t anything to bemoan, either. The market was up 60% and 62% of the time, respectively, for average gains of 0.66% and 1.17%.
And while historical gains in December aren’t as strong, the percentage of time that the Dow rallies is stronger. Over the last 20, 50 and 100 years, stocks rallied in December 70%, 68% and 73% of the time, respectively.
Is seasonality always accurate? Nope. But is it instructive and relevant? Yup.
~ Bullish Factor #7: Get Out The Vote!
Now it’s time to start talking elections. They’re agonizing for candidates and voters, alike. Not so much for stocks, though.
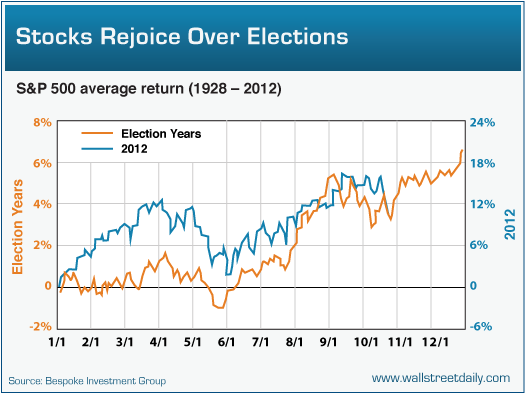
As I’ve noted here before, stocks have a penchant for rallying during presidential election years. And so far this year, stocks are sticking to the script – just like President Obama to a teleprompter.
With history as our guide, the rest of the election year should be full of celebration -- at least for investors.
~ Bullish Factor #8: The End Of Uncertainty
After next Tuesday, an enormous uncertainty weighing on the market is going to be lifted. We’ll finally know who’s going to be leading our great nation for the next four years.
I pity the fool who thinks such uncertainty hasn’t been holding back stocks. And businesses.
Non-financial companies have been clinging to a stunning $1.7 trillion in cash. I don’t blame them. There’s zero information on upcoming policies to help identify the best way to allocate the cash.
But once executives know the leader -- and the policies -- that are going to be in place during the next presidential term, you can bet they’ll start investing (and hiring) again.
The end of the election also means Congress can get to work eliminating the uncertainty surrounding the Fiscal Cliff.
A compromise (which is the only option) would be enormously bullish for equities, as Sam Stovall, Chief Investment Strategist at McGraw Hill, told Fox Business.
How bullish? Enough to possibly push stocks up by 18.5%.
And as Ed Yardeni, President of Yardeni Research, said about a compromise, “Instead of falling off a cliff, there would be a Second Recovery for the U.S. economy led by housing and autos.”
Speaking of housing…
~ Bullish Factor #9: From Hindrance To Help
The housing market contributed mightily to the last economic and stock market collapse. Now, it’s starting to contribute to the recovery.
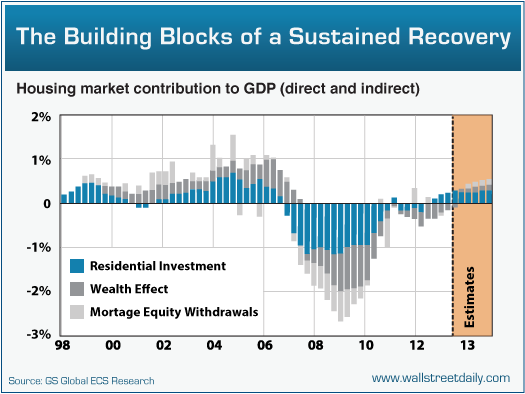
Take a look at this chart from the economists over at Goldman Sachs (GS).
As you can see, housing’s contribution to GDP is transitioning from a huge hindrance to a huge help to the overall economy.
Goldman estimates that direct residential investment growth alone will accelerate from 10.4% year-on-year in 2012 Q2 to 13% by the end of 2013.
Add in the “wealth effect” from increases in home prices, and we’re talking about a half-point contribution to GDP growth. That might not seem like a lot. But it actually translates into a 25% increase to the current GDP growth rate.
In my opinion, that’s on the conservative side. Either way, it’s a net positive for the stock market.
~ Bullish Factor #10: The (Investment) Theory Of Relativity
In terms of relativity, stocks represent an investor’s best choice.
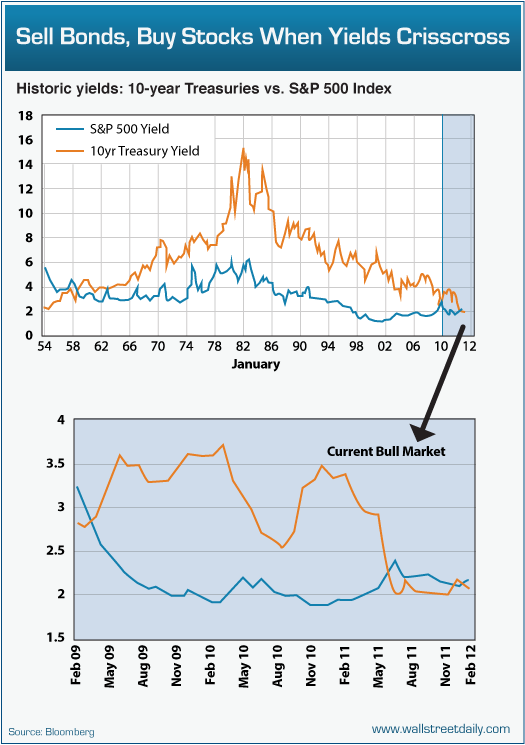
Case in point: Cash yields nothing. Treasuries don’t either. In fact, Treasury bonds are bid up so high that the S&P 500 Index yields more (2.13% versus 1.72%). And that’s an extremely rare occurrence.
Truth is, it’s only happened about 20 times on a quarter-over-quarter basis in the last 60 years. And each time, the S&P 500 rose by double digits over the next year.
Bottom line: Stocks are the only bargain in town. And although the S&P 500 Index has more than doubled in price since the 2009 bottom, stocks remain cheap at just 14.28 times earnings.
Keep in mind, when the stock market peaked in 2000, the S&P 500 traded for 35 times earnings. We’re nowhere close to that level.
A simple rally back to the long-term average price-to-earnings multiple implies a double-digit upside. I’d hate for you to miss out.
Ahead of the tape,
Original post
