Hello traders!
Today we will talk about Chinese Yuan - Renminbi! We will show you how it looks like in different time frames from Elliott Wave perspective!
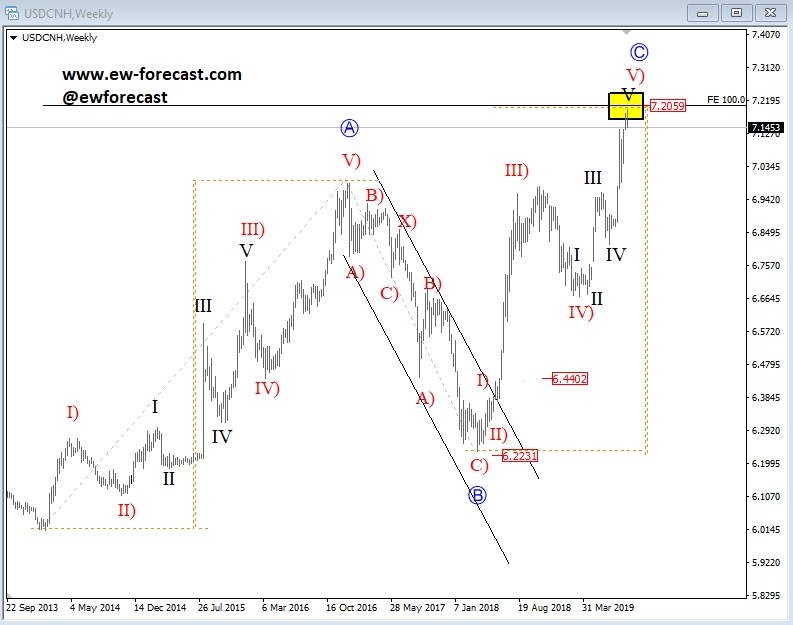
Well, looking at the weekly chart, we can see a big three-wave A-B-C rise since 2013, which can be approaching important target for the equality measurement of waves A=C around 7.20 and we can clearly see a five-wave rally for wave C!
USD/CNH, Weekly

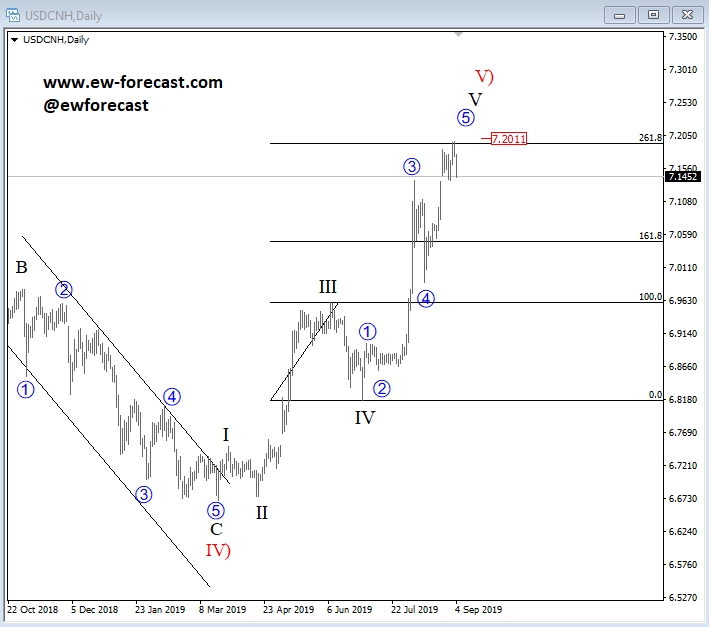
In the daily chart we can see a closer look of the final wave V)/C, where we can clearly see these five waves up towards important Fibonacci 261,8% extension target around that 7.20 area!
USD/CNH, Daily

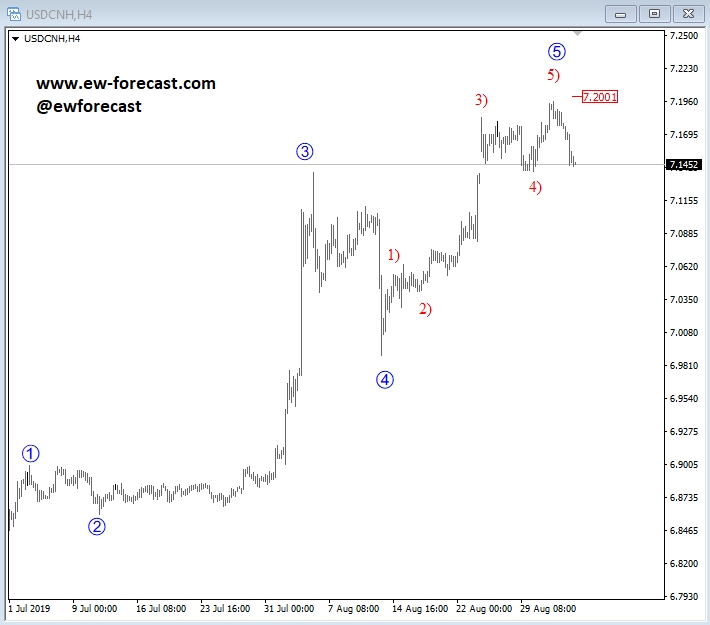
And, if we take a look even in the smaller time frame – 4h chart, we can see another five-wave cycle of a lower degree of that final 5th wave, which already shows an evidence of the potential top!
USD/CNH, 4h

However, we know that in EW theory, after every five waves, a three-wave pullback follows, but according to the weekly chart, where we see a completed A-B-C rise, we would not be surprised if USD/CNH starts falling sharply after reaching that final wave 5 of C!
Be humble and trade smart!
Disclosure: Please be informed that information we provide is NOT a trading recommendation or investment advice. All of our work is for educational purposes only.
