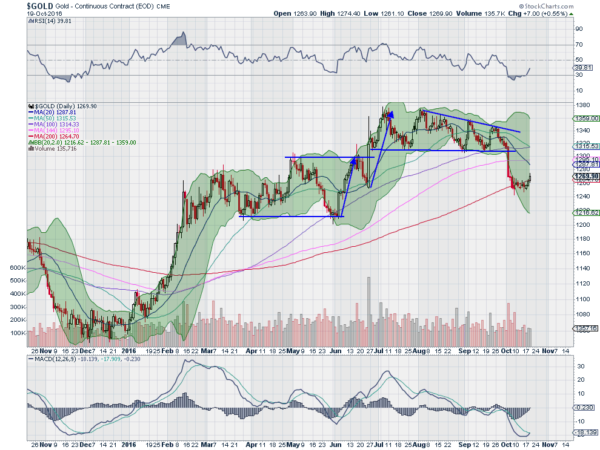
Gold had a good run higher from the start of the year until August. But the two months that followed saw gold consolidate in a descending triangle. It fell out of that triangle at the start of October and raced lower, gravity works. Gold found support at the 200 day SMA just a few days later and $100 lower.
The question then became whether that was it for gold or would it rest for a while and make another drop, down to the 1210 area. That would be a 50% retracement of the move higher. The drop to 1250 was already a 38.2% drop, a key Fibonacci retracement level for traders. And with the 200 day SMA right there, the arbiter of bull vs bear, a bounce would be reasonable.

The chart above shows that the heavy yellow rock did start a move higher, a bounce, on Wednesday. And as I write this Thursday morning it is continuing to hold higher. The momentum indicators have turned as well. The RSI is rising towards the mid line, and the MACD is about to cross up, a bullish signal. A move over 50 in the RSI and continued movement in the MACD up to a positive level would be the next thing to look for as an indication that this is not just a dead cat bounce, but a solid higher low in a 11 month trend higher.
The information in this blog post represents my own opinions and does not contain a recommendation for any particular security or investment. I or my affiliates may hold positions or other interests in securities mentioned in the Blog, please see my Disclaimer page for my full disclaimer.
