Markets are off to a relatively subdued start to the week, with global equities edging lower and the US dollar ticking higher despite the lack of market-moving economic data. Probably the biggest development over the weekend was the not-so-surprising revelation that the Greece Doomsday clock is within five minutes of midnight. In a leaked internal document, the IMF stated what any neutral observer already knows, that ““there will be no possibility for the Greek authorities to repay the whole [€1.5B debt payment due in June]” without further bailouts. Adding insult to injury, ECB member Yves Mersch warned that Greece was at the “endgame” and that the current situation is “not tenable.”
The Greek government can probably limp its way through the next two weeks, but the true crunch time starts June 5th, when a whopping €1.5B of debt payments to the IMF is due over a 14-day period; this represents twice the size of last month’s debt payment, which already forced the government to draw on the IMF’s reserve account and raid municipal funds. With seemingly no near-term deal in the works, traders can expect headlines out of Greece to drive trade in the euro more and more as we head into early June.
Technical View: EUR/USD
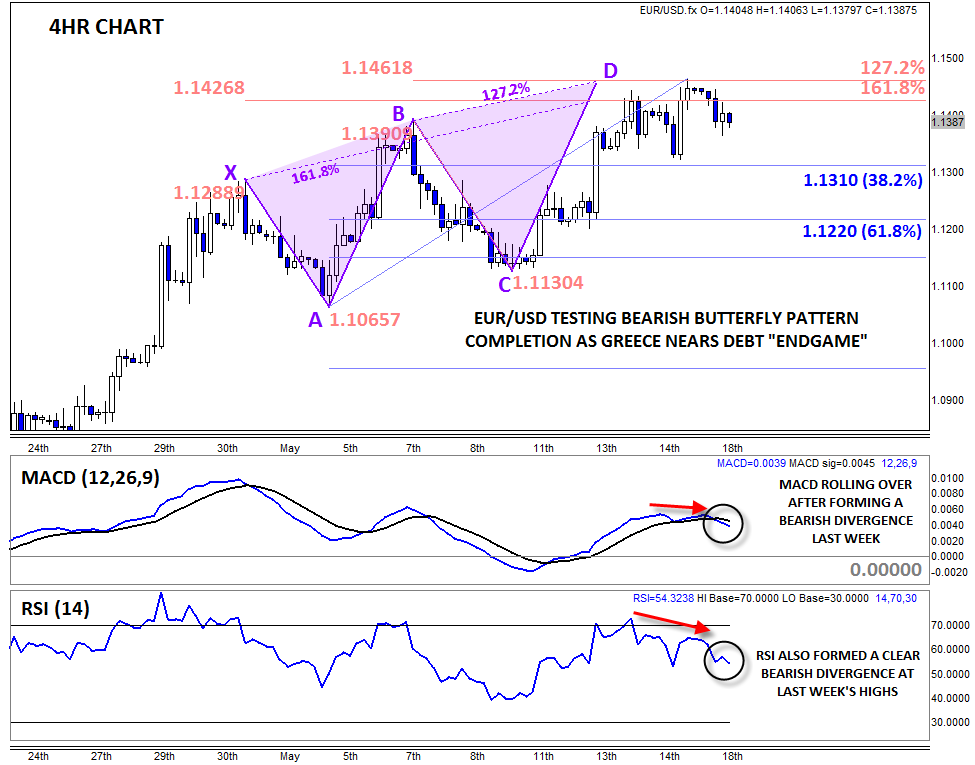
For now, the market remains optimistic that some sort of Greek debt deal will be worked out at the last minute. EUR/USD has edged back below 1.1400 to start the week, but the pair still remains within 100 pips of last week’s 3-month high at 1.1470. That said, the pair has carved out a bearish technical pattern over the first half of May, suggesting that we could see a deeper pullback early this week.
As the chart below shows, EUR/USD has put in a clear Bearish Butterfly pattern, marking a confluence of three major resistance levels in the mid-1.1400s (the 161.8% Fibonacci extension of XA, 127.2% extension of BC, and ABCD pattern completion). The tight convergence of three separate resistance levels suggests that rates may have formed a near-term top late last week. This view is supported by the MACD and RSI indicators, which both have turned lower after forming a bearish divergence last week.
If the bearish butterfly pattern plays out as expected, it would suggest a move down toward the 61.8% Fibonacci retracement of the entire ABCD pattern at 1.1220, though the 38.2% retracement at 1.1310 could serve as a more achievable near-term target. Of course, any technical pattern can fail, and if EUR/USD breaks conclusively above last week’s high at 1.1465 (especially if accompanied by a breakthrough in Greece’s debt negotiations), a move toward 1.15+ could be seen next.

