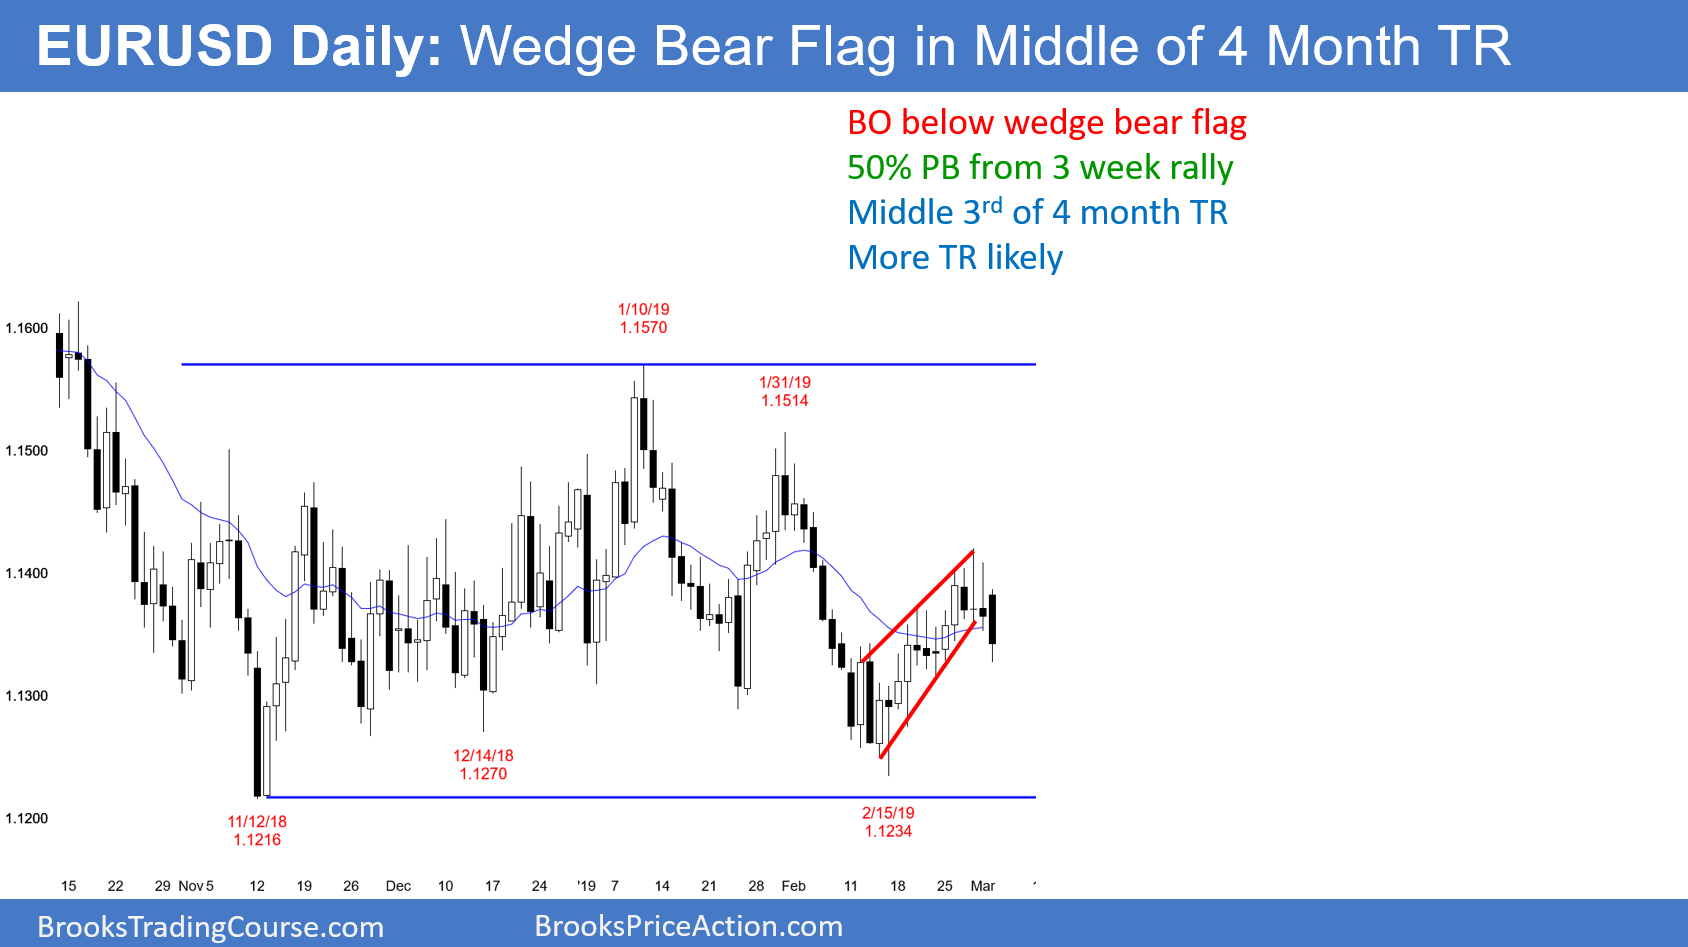
I wrote last week that the EUR/USD daily Forex chart would pull back early this week. This is because the 3-week rally was in a wedge, which is a buy climax. Buy climaxes lead to exhausted bulls, who then take profits.
Furthermore, I said that the 3-week rally was strong enough so that the 1st leg down would likely stall about half way down. There is support at the February 19th and 22nd lows. The overnight selloff is near that support. In addition, the chart has been in a tight trading range for 9 days. That February 19 low at around 1.13 is the bottom of the range. Therefore, the daily chart will probably work sideways to down a little more this week.
I have repeatedly made the point that the chart has had many strong legs up and down, but that each one was more likely to reverse than to begin a trend. There is no sign that the 4 month range is about to break into a trend. Consequently, traders will continue to look for reversals every 2 – 3 weeks.
Because this 4-month range is unusually long, there will probably be a breakout within a month. Traders are waiting for information on Brexit, which has been very slow to resolve.
Overnight EUR/USD Trading
The EUR/USD 5-minute chart sold off 45 pips overnight. It therefore broke below the bull trend line of the past 3 weeks. However, the overnight selloff was not strong. It is therefore unlikely to be the start of a move down to the February low. Instead, the bulls will probably buy again between 1.1250 and 1.13.
Since the daily chart has been in a 100 pip range for 9 days, there is no sense of urgency. Traders think the price is just about right. When that is the case, they buy low and buy more lower, they sell high and sell more higher, and they take small profits. They do not believe that any leg up or down will go far. Day traders have been looking for reversals and brief breakouts. They have been scalping for 10 – 20 pips.
