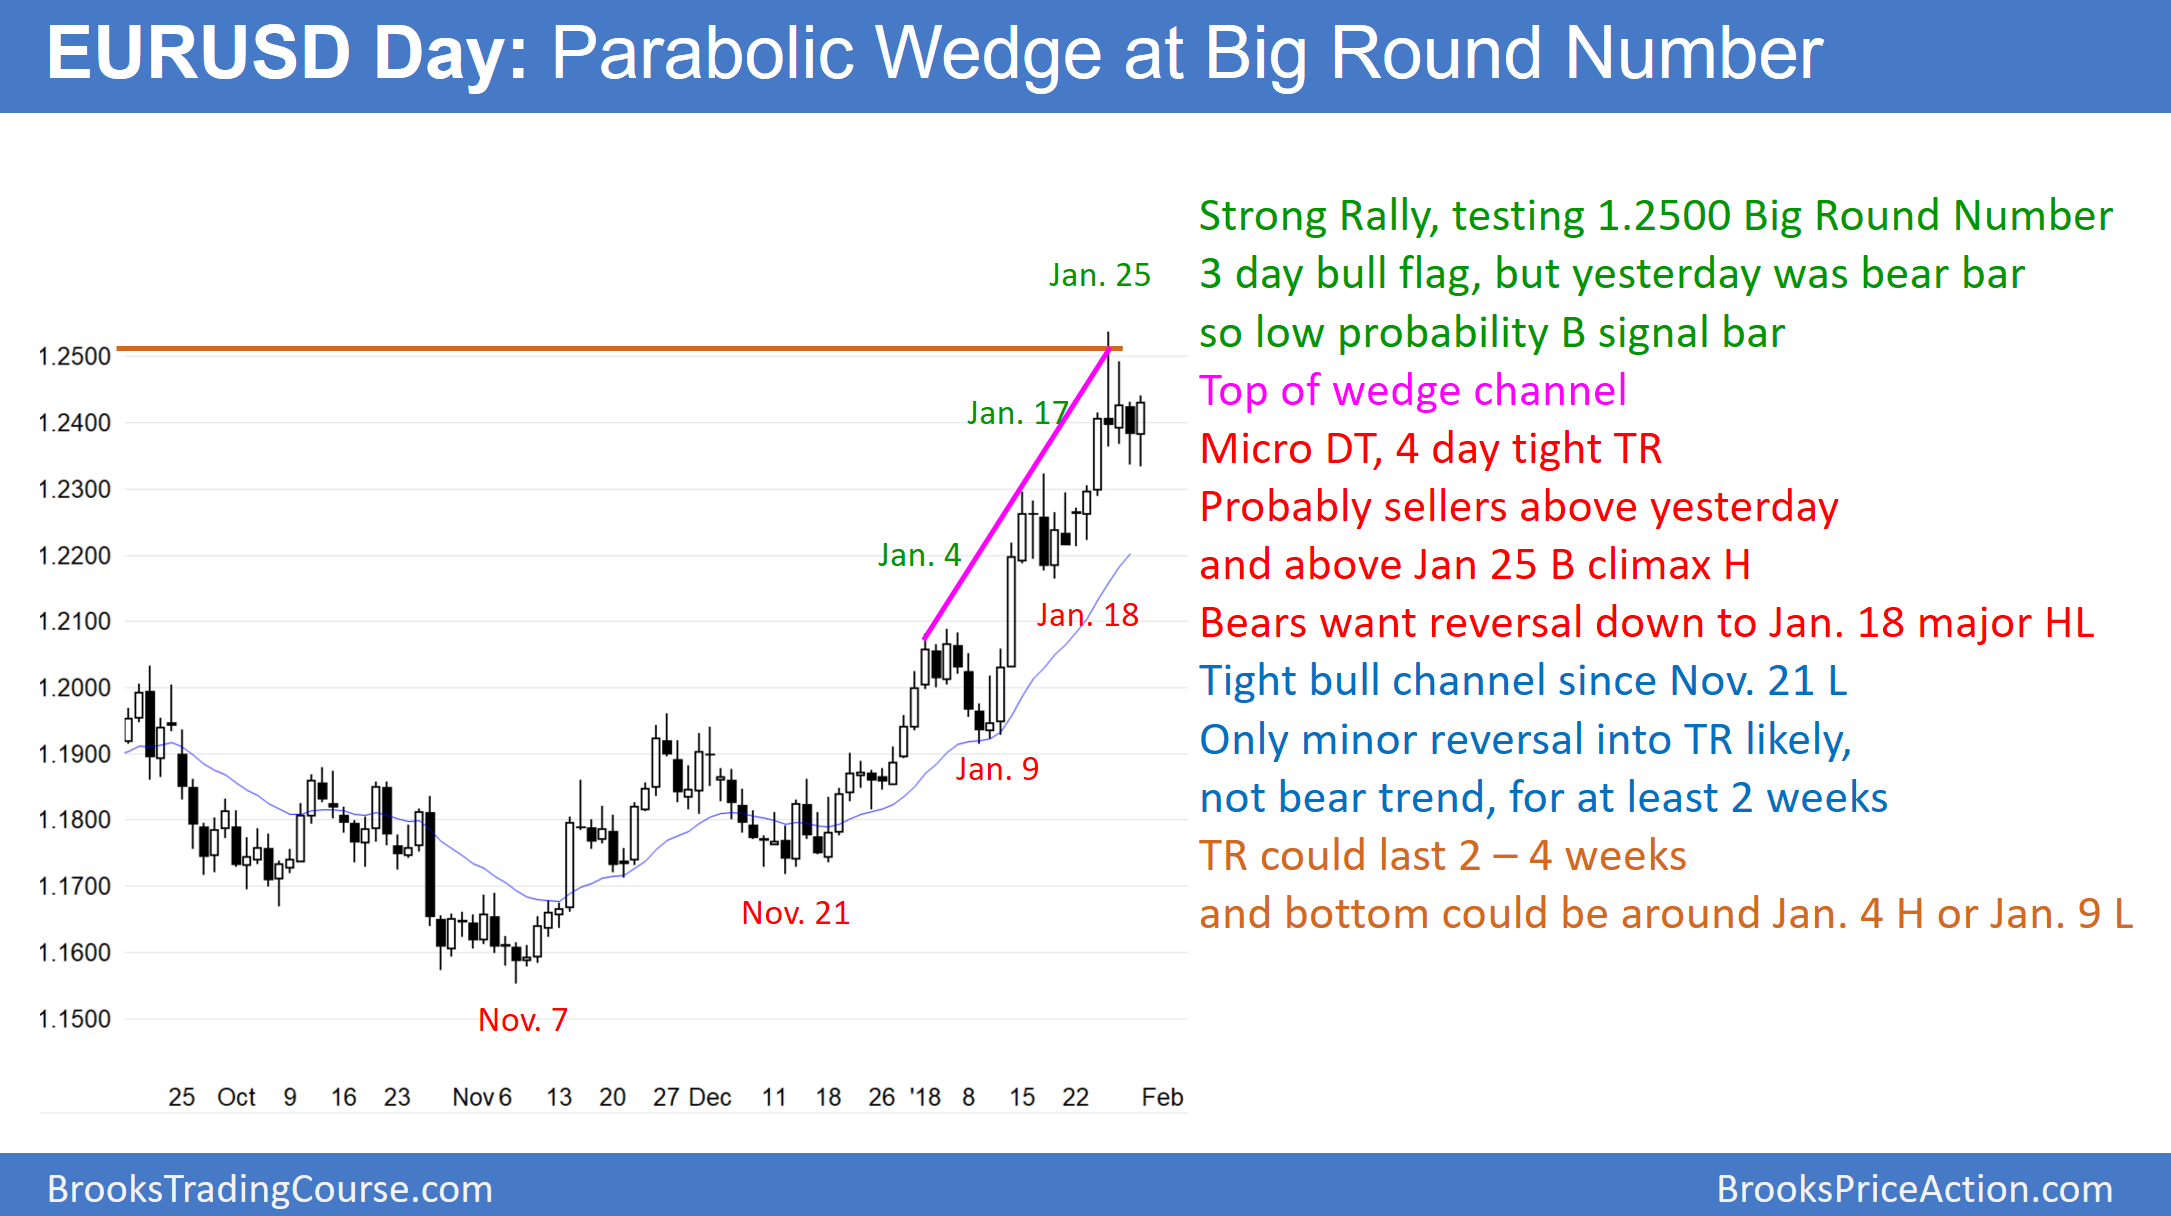
The EUR/USD daily Forex chart is in a buy climax at the 1.2500 Big Round Number. The odds are that it will enter a trading range for at least 2 – 4 weeks.
The EUR/USD daily Forex chart is in a strong bull trend. The 3-day pullback is therefore a bull flag (High 1 bull flag). Yet, yesterday was a big bear bar. Hence, it is a low probability buy setup. Furthermore, there is a parabolic wedge at the 1.2500 Big Round number. In addition, there was a micro double top last week. As a result, the odds are that there will be sellers above yesterday’s high and above the top of the parabolic wedge (last week’s high).
While the bulls hope for a strong breakout above last week’s high, it is more likely that the strong bull trend is transitioning into a trading range. The sideways to down trading will probably have at least 2 legs sideways to down. Also, it will probably last at least a couple of weeks. Finally, the selloff will probably test support below. Typically, the 1st target is the bottom of the most recent buy climax. Hence, there is a magnet a the January 18 low.
Overnight EUR/USD
The EUR/USD 5-minute Forex chart rallied 100 pips overnight from a double bottom and a 3-day High 2 bull flag. The rally is strong enough so that the bulls will buy the 1st pullback. Yet, because of the buy climax on the daily chart, the odds favor sideways to down trading over the next couple of weeks. Consequently, bears will look to sell the rally and sell above last week’s high.
Since the overnight rally is in a tight bull channel, the best the bears can probably get over the next few hours is a trading range. Yet, the bears will look to swing trade at least part of their shorts if there is sell setup on the 60 – 240 minute chart this week.
The bulls will switch to only buying pullbacks because they know the odds are beginning to favor a trading range on the daily chart. Moreover, they will be quicker to take profits on rallies.

