Investing.com’s stocks of the week

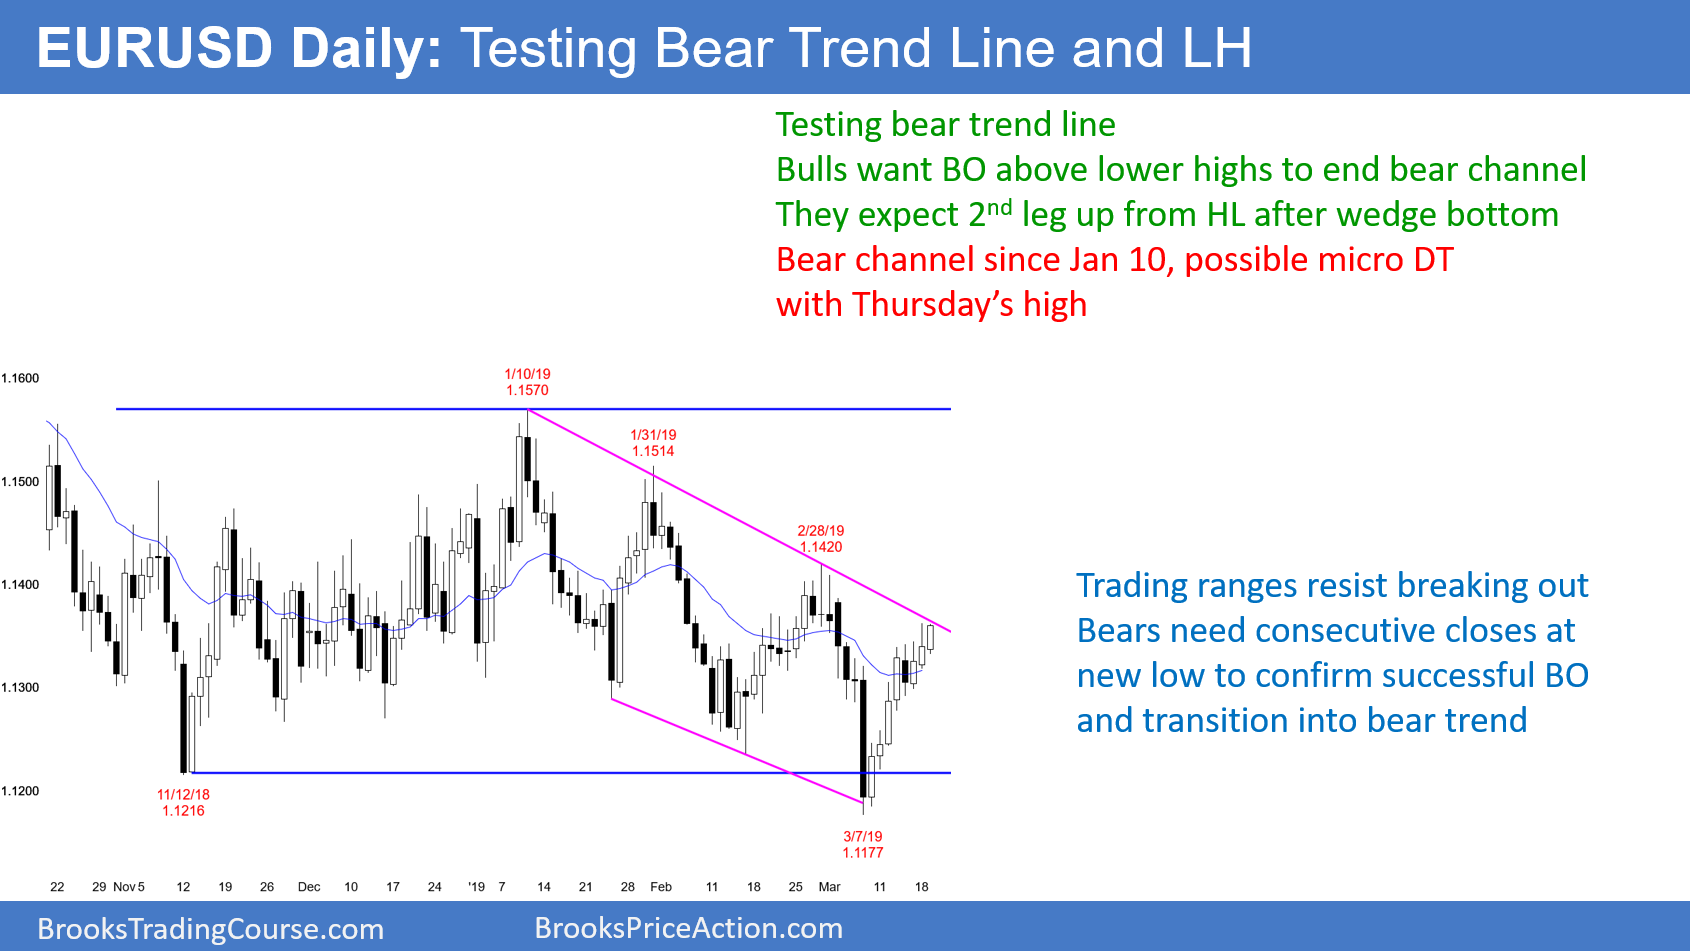
The EUR/USD daily Forex chart has rallied for 3 weeks. Today’s high so far is withing a few pips of the bear trend line that began with the January 10 high.
More importantly, it is only 58 pips below the February 28 lower high. As long as the chart continues to make lower highs, it is in a bear trend. If the bulls can break above that 1.1420 lower high, the bear trend will have ended.
When a bear trend ends, the chart is in a trading range and sometimes in a bull trend. There have been many strong rallies and selloffs over the past 4 months. Each was strong enough to be the start of at trend. However, during each, I always said that a leg in the trading range was more likely than the start of a trend.
That is still true. Until there are consecutive closes above or below the 4 month range, every strong rally or selloff is more likely to reverse than begin a trend.
Still In Trading Range So Expect Reversals
Every rally or selloff over the past 4 months has reversed within about 3 weeks. This current rally has lasted 8 days and it is now near resistance. The odds are it will reverse.
But, in trading ranges, reversals often occur after going beyond support or resistance. Consequently, the reversal will probably take place only after the rally goes above the bear trend line or the February 28 lower high.
Because the daily chart has a wedge bottom, the bulls will buy a selloff that retraces above half of the 2 week rally. The odds favor a 2nd leg up on the daily chart after a 1 – 2 week selloff to a higher low.
Overnight EUR/USD Trading
The EUR/USD 5-minute chart continued yesterday’s weak rally. There is now a small double top on the 5-minute chart just below the bear trend line on the daily chart.
This is also the 3rd push up on the 60-minute chart. Consequently, the rally is a buy climax at resistance.
But, the daily chart is in a trading range. When a rally is very close to resistance, it usually goes beyond the resistance before reversing. Therefore, the 5-minute chart will probably get above the bear trend line this week before trading down for a week or so. It might even have to go above the February 28 lower high as well.
Because the 5-minute chart has been in a 30-pip range for the past 6 hours, day traders have been scalping. However, since the rally is near resistance on the daily chart, traders expect a 100 pip selloff to begin within a week. They therefore will begin to look for swing trades from a reversal down. But, they 1st need to see bigger bars and bigger legs on the 5-minute chart. Until then, they will continue to scalp.
