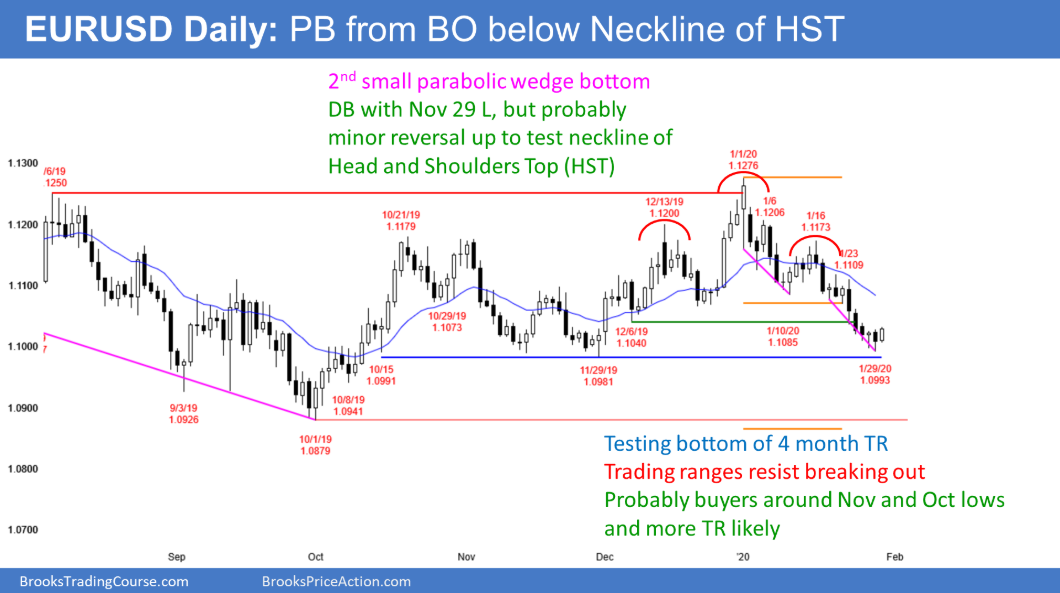
The daily chart of the EUR/USD market is just above the bottom of a 4-month trading range. This is the buy zone. But even if the selloff continues down to the October low, traders will still look for a 2 – 3 week, 200 pip rally. That is because every strong leg up and down for the past 20 months reversed within a few weeks. There is no reason to assume that this 5 week selloff will be different.
Also, after a break below the neckline of a head and shoulders top, there is usually a rally back to the breakout point. That is a breakout test. Traders want to see if the bears will sell again at that price. Will the breakout continue down for one or more legs, or will it fail? There are often 2 – 3 possible prices for the neckline. Traders expect a bounce up to the December 6 low or even the January 10 low within a week or two.
On the monthly chart, January is an outside down month. The month closes tomorrow. The bears want January to close far below the December low. That is unlikely because the monthly chart has been in a tight trading range for 6 months. Tight ranges resist breaking out. Consequently, January will probably close around or above the December low.
Overnight EUR/USD Trading
The 5-minute chart of the EUR/USD rallied slightly overnight. It just broke above yesterday’s high. Yesterday was an outside down day on the daily chart. Today is therefore breaking above the neckline of a 2-day micro double bottom.
The daily chart is oversold and the December low is a magnet above on the monthly chart. Traders should expect sideways to up trading through tomorrow’s close when January ends.
That does not mean a strong bull trend. All the bulls need is slightly higher prices. Traders so far are not looking for a big trend up. But they will buy any 20 – 30 pip selloff through tomorrow’s close, knowing that January will likely close near or above the 1.1040 December low.
