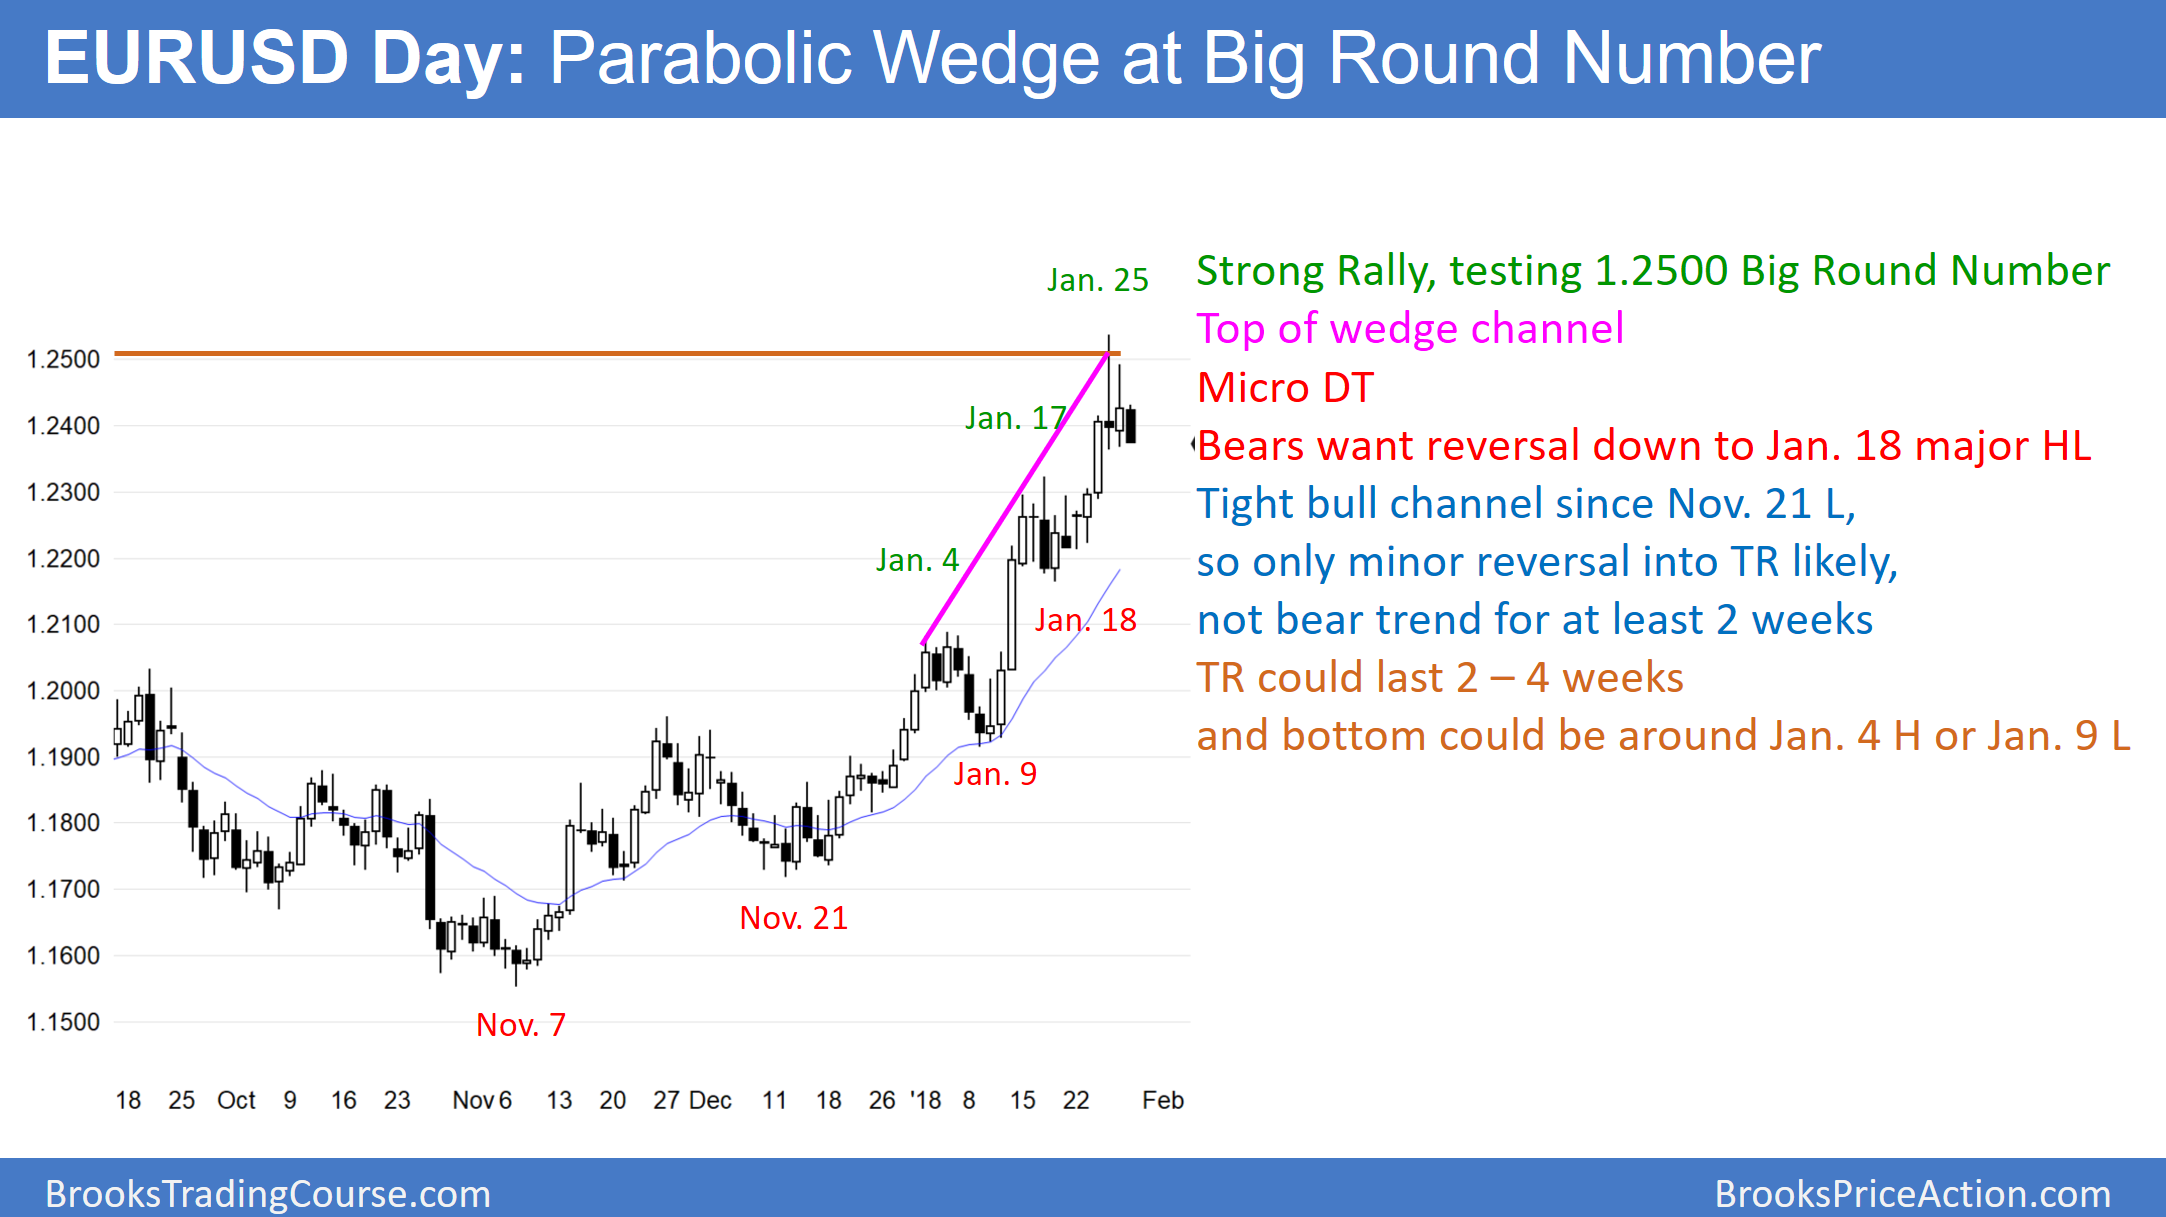
The EUR/USD daily Forex chart is in a bull trend. Since the rally is in a tight bull channel with 3 buy climaxes, it is a parabolic wedge. There was a micro double top on Thursday and Friday. Finally, the buy climax is at the 1.2500 Big Round Number.
As strong as the rally from the November low has been, all trends eventually pull back. This one is showing signs that it is about to transition into a trading range. A trading range is a pullback that lasts 10 – 20 or more bars. If it lasts more than 20 bars, the probability of a trend reversal approaches 50%.
The rally from the November 7 low tried to for a top on November 27 after 2 legs up. Instead, the bulls got a strong breakout. That breakout led to 3 consecutive buy climaxes in a wedge channel. This is a 2nd consecutive complex top attempt. Second attempts have a higher probability of success.
The 1st goal of the bears is a pullback that has 2 legs and lasts about 10 bars. The pullback usually tests the bottom of the most recent buy climax low. That is the January 18 low of 1.2164, which is almost 400 pips down from the high. Of all of the things the chart can do over the next month, this is the most likely.
Trend resumption up or trend reversal down
Just like the late December rally broke above the November 27 top attempt, the bulls want a strong breakout and measured move up above last week’s top attempt. While they might get a breakout above last week’s high, the odds are that there will be sellers above and the breakout will fail. The series of buy climaxes over the past 3 months probably means the bulls are exhausted. Consequently, they will begin to take profits.
In addition, they will wait to buy again for at least 10 bars. They want to see if enough strong bears come in to create a bear trend. If the selloff is not strong, the bulls will buy for a test of the high. If their rally is weak, the chart will enter a trading range, which could last 2 – 3 months.
Overnight EUR/USD Forex trading
The EUR/USD 5 minute chart last night had a 2nd leg down from Thursday’s high. The bulls want a double bottom and then a breakout above last week’s high. If they get their breakout, the odds are that it will fail because of the buy climax on the daily chart.
The bears want Friday’s high to be a lower high major trend reversal on the 5 minute chart. A strong breakout below Thursday’s low today or tomorrow would lead to a measured move down to around the January 18 low.
At the moment, the 70 pip overnight selloff does not have strong momentum. Consequently, the bulls will probably get a bounce from around current levels (Thursday’s low). However, the bears will sell rallies, hoping for a swing down on the daily chart.
The bulls will look to buy the current test of Thursday’s low. But, given the topping pattern on the daily chart, they will probably take profits above last week’s high. Consequently, the best they will probably get over the next week is a bull leg in what will become a trading range.

