Investing.com’s stocks of the week

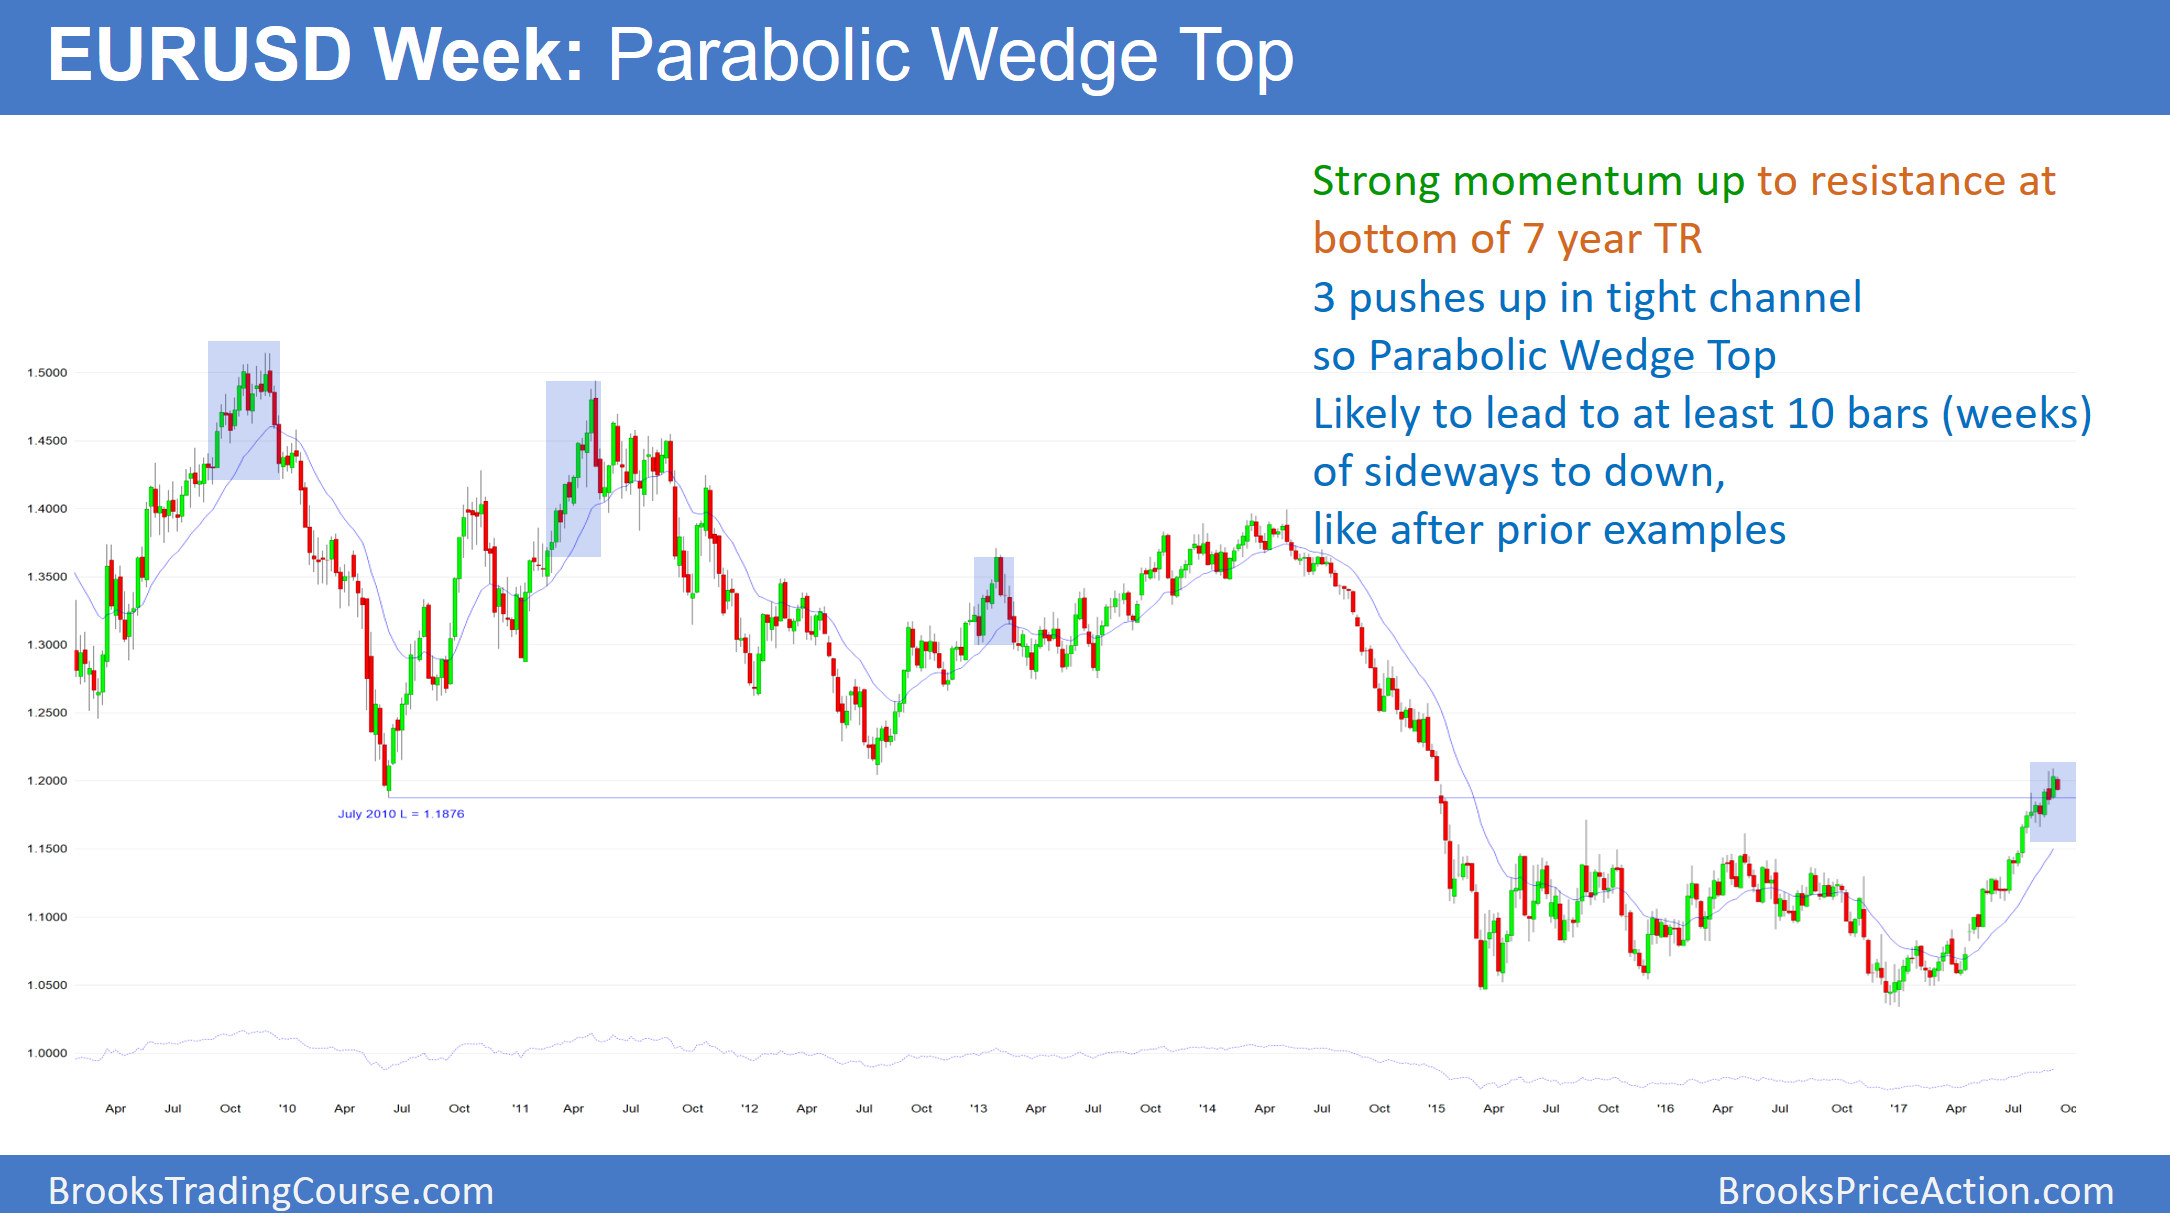
The weekly EUR/USD Forex chart has a bear bar so far this week after last week’s strong bull bar. This is the 3rd consecutive time that a bear bar followed a strong bull bar. Hence, this is a parabolic wedge top. In addition, it is after resistance. Furthermore, the rally has been long and therefore climactic. When this has happened in the past, it marked exhaustion and the end of the rally for at least 10 weeks.
The weekly EUR/USD Forex chart has a parabolic wedge buy climax at resistance and after a buy climax. There is a 60% chance that this will lead to ten or more bars of sideways to down trading, as it has in the past. Yet, the rally since April has been in a tight bull channel. Therefore the 1st reversal down will probably be minor. Consequently, the best the bears will probably get is a pullback. Since support is at the top of the 2 year trading range at around 1.1600, the trading range could be 400 pips tall.
There is always a bull case, and there is a 40% chance that the parabolic wedge will fail. For example, the bulls tried to create a parabolic wedge bottom in December 2014. Yet, the bears got a bear breakout below the wedge bottom and then a 1700 pip selloff. However, this rally is the 1st attempt to break above the bottom of a 7 year trading range, which is major resistance. Since 1st breakout attempts usually lead to pullbacks instead of successful breakouts, the odds are that the weekly chart will pull back soon.
Overnight EUR/USD Forex trading
While the 5 minute chart sold off 50 pips over the past 6 hours, the selloff lacked consecutive big bear bars. In addition, it is near the support of Thursday’s buy climax low and the daily moving average. Furthermore, yesterday’s tight trading range is a magnet. Finally, there is an FOMC announcement next week, which is a catalyst. Markets usually enter a trading range before major announcements. Consequently, day traders expect more trading range trading again today, which means they plan to scalp.
