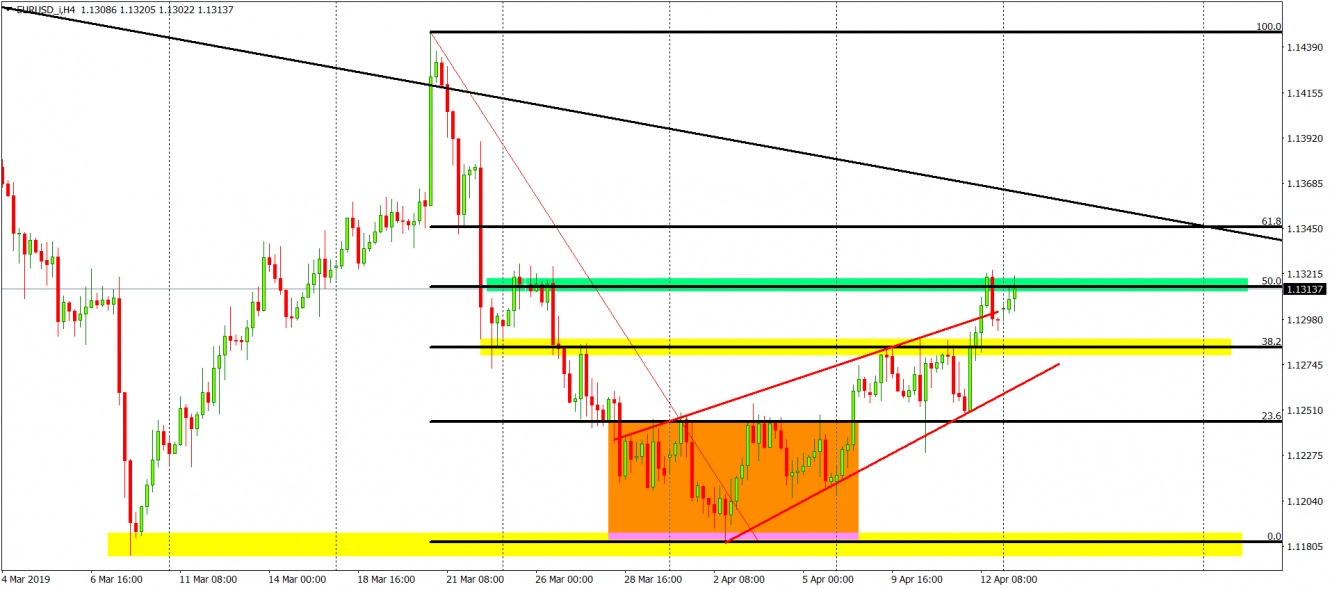
April has certainly been a very eventful and important month for the main pair on the market – EUR/USD. We started the month really low with an ugly perspective for new long-term lows. Luckily for buyers, the pair managed to bounce from the support created by the lows from March and went higher.
The bounce itself was very technical. EUR/USD managed to form an inverse head and shoulders pattern (orange), which on the 8th of April, resulted in a breakout of its neckline along with the 23.6% Fibonacci. That gave us a buy signal and allowed us to challenge the next resistance; the 38.2% Fibo. That one was broken on the 12th of April and allowed us to challenge the next resistance, another Fibonacci! This time 50%. Interestingly, all those Fibonacci retracements are in line with recent price movements, so important supports and resistances from March.
50% is currently the closest resistance and today is being tested for the second time. Demand looks really strong, so a breakout is very likely. There is one additional thing that has to be mentioned. The recent correction, for most of the time, was shaped as a flag (red lines), which was one bearish factor here. On Friday, EUR/USD managed to break the upper line of this pattern, which denies it and takes away this bearish argument from sellers’ hands. The buy signal will be denied if the pair breaks the 23.6% Fibonacci, but that scenario doesn’t seem very likely at the moment.

