
Volumes, Correlations, Price Action for Aug 17th
EUR/USD: Market Looks Set to Stay Within Contained Range
Volume, Price Action, Correlations, Fundamentals (H4)
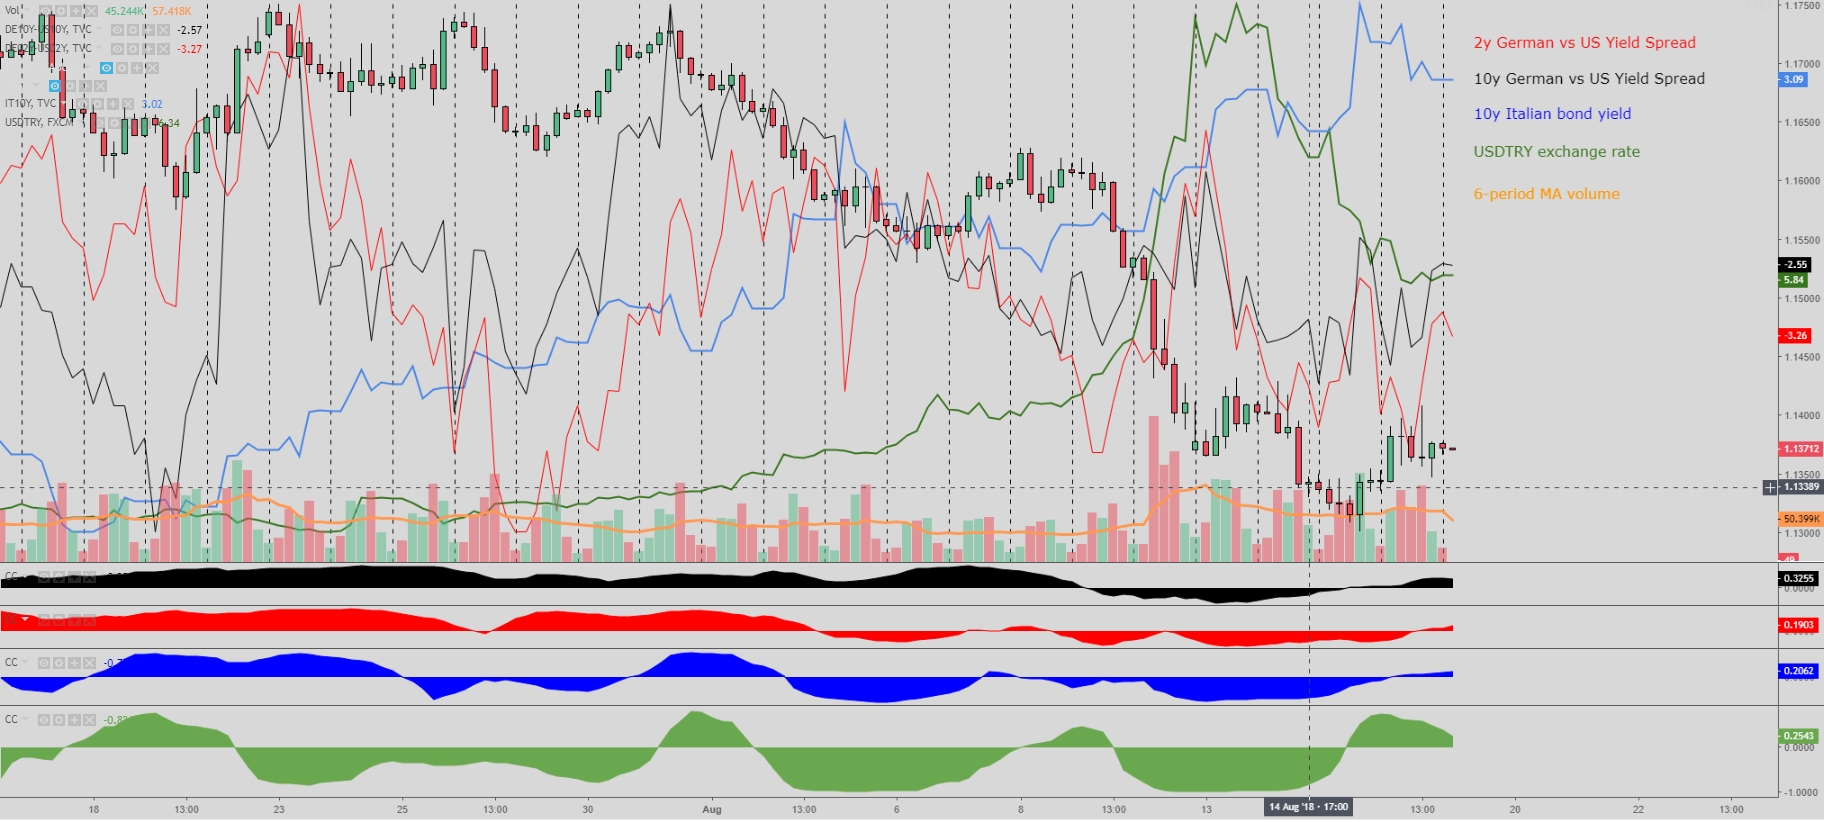
The recovery in the Euro/US Dollar rate was unimpressive to say the least, as bids found a large supply imbalance as 1.14 area got tested. The volumes and price action (shooting star and retest on low volume) are not supporting further climbs in the pair as it stands, especially in the context of a well-established downtrend. The slight uptick in long and short-dated German vs US bond yields may add some upward pressure with the correlation on a 3-month basis of a 3-day return being at the highest this year near 90%. While a source of imminent risk includes the elevated Italian bond yields (negative EUR), a temporary reprieve from highs, together with a higher Turkish Lira, adds to the case for the price to still find decent pockets of buy-side liquidity on dips, hence expecting bids to re-emerge to contain the downside. Overall, price action and volume are skewed to the downside but correlations appear supportive at the margin, therefore, unless new developments in China or Turkey and amid no data releases in Europe or US, range-trading might be on the cards this Friday, with top-bottom edges well defended.
Technicals and Levels (30m)
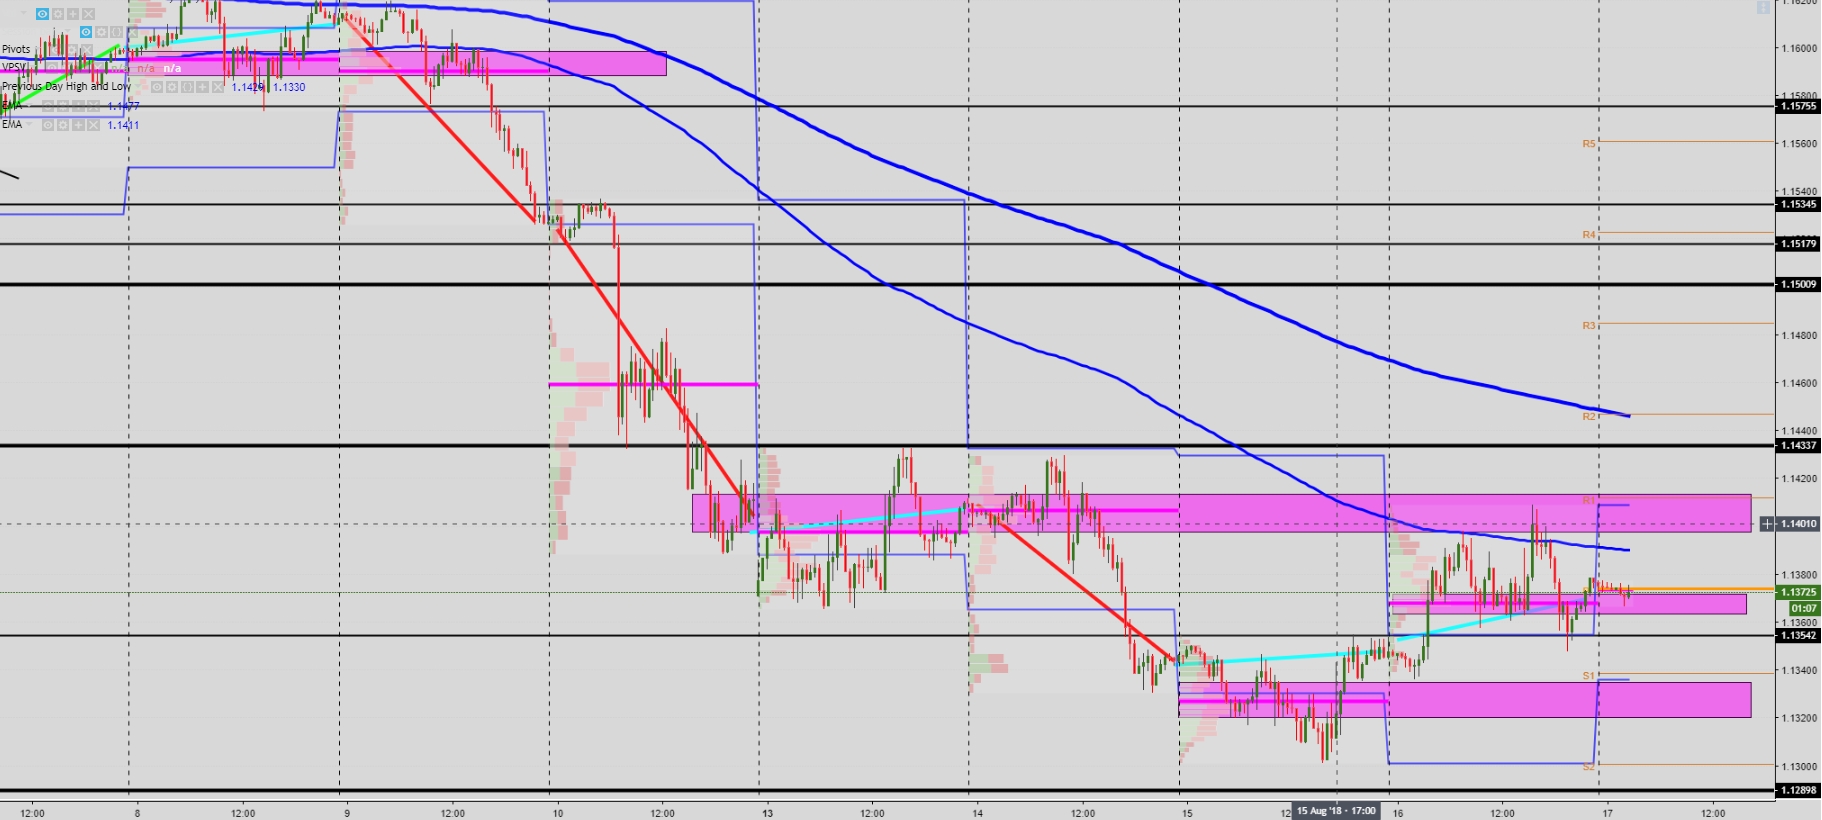
The corrective nature of the price action came to an abrupt halt at the test of the anticipated wall of offers circa 1.14, which represents the Aug 14th PoC and an area of value for the market. The impulsive move down from the top edge has led into a 5-legs intraday push being negated as the market appears to now enter a phase of consolidation, with the last 2 days failing to create any new cycle as per the magenta lines, which indicate not enough impulse in either direction. Based on the assumption that the contradictory indications between vol/price action and correlations will continue to hold true, and with Thursday’s PoC having found equilibrium in the middle of the range, an initial 0.5c range between 1.14 and 1.1350 might be expected, with the usual caveats of manipulation risks to take pockets of liquidity beyond these levels, which would represent a maximal extension of 1.1410-15 to the upside, while on the downside, 1.1330, which remains an untested PoC from Aug 15 should hold the potential selling tides.
GBP/USD:Sterling Saved by Weak USD, Remains Vulnerable
Volume, Price Action, Correlations, Fundamentals (H4)
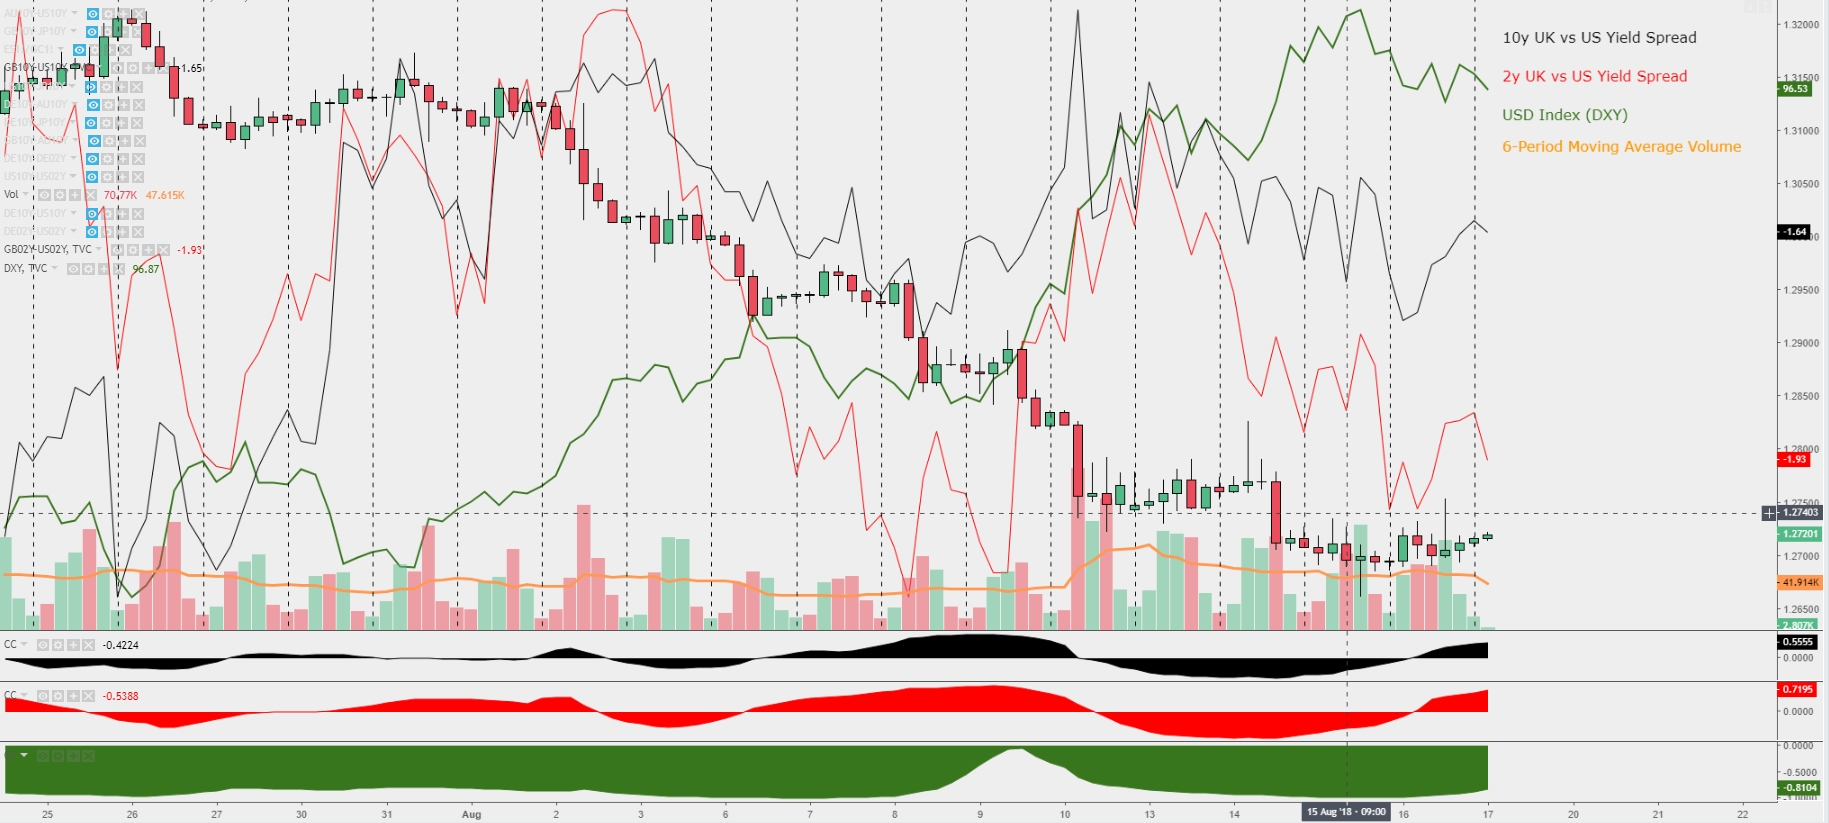
The downtrend remains nonvolatile in the H4 timeframe, which continues to develop amid a bearish technical background as per the lower lows and lower highs. The latest price action, with a shooting star followed by a retest of higher levels on tapering volumes, is suggestive of a market prone to test lower levels. However, a weaker USD coupled with higher UK vs US yields spreads pose a risk to be overly short committed. Notwithstanding the pick up in yields, not that as in the case of spot Sterling, yield spreads have also been printing lower lows and lower highs, hence technically speaking there might be added pressure to be sent lower once again, in which case it may add to the bearish case. In terms of fundamentals, the recent UK retail sales is a positive input for the Sterling, with Friday’s calendar vacant.
Technicals and Levels (30m)
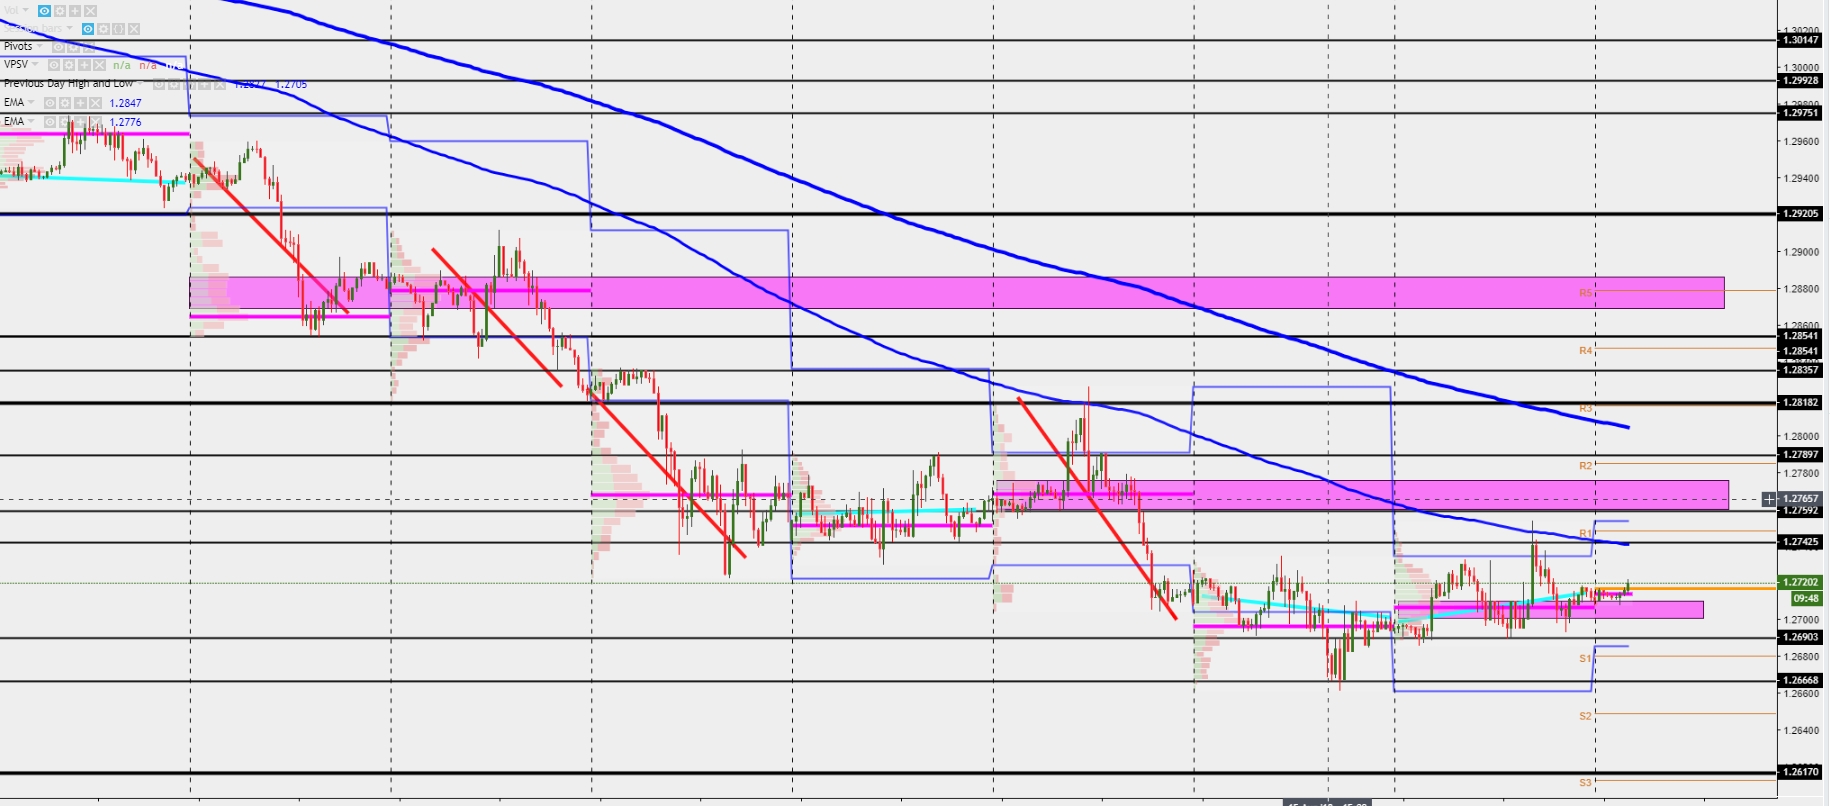
The chart is starting to exhibit much more choppy conditions, with the erratic non-directional behavior likely to extend as long as the US Dollar stays weak. The area of resistance between 1.2740 and 1.2760-70 (Aug 14th PoC) should see renewed selling interest to keep the overall downtrend dynamics valid, while on the downside, other than the usual pocket of liquidity at 1.27, expect 1.2690 ahead of 1.2670 to act as immediate support. The sterling stands as one of the most fragile currencies to see the downtrend resume, therefore the risk is by and large still to see sellers capping the upside while the downside continues exposed until the next significant macro support around 1.2620 is met.
USD/JPY: ‘Risk On’ Backdrop May Not Be Enough
Volume, Price Action, Correlations, Fundamentals (H4)
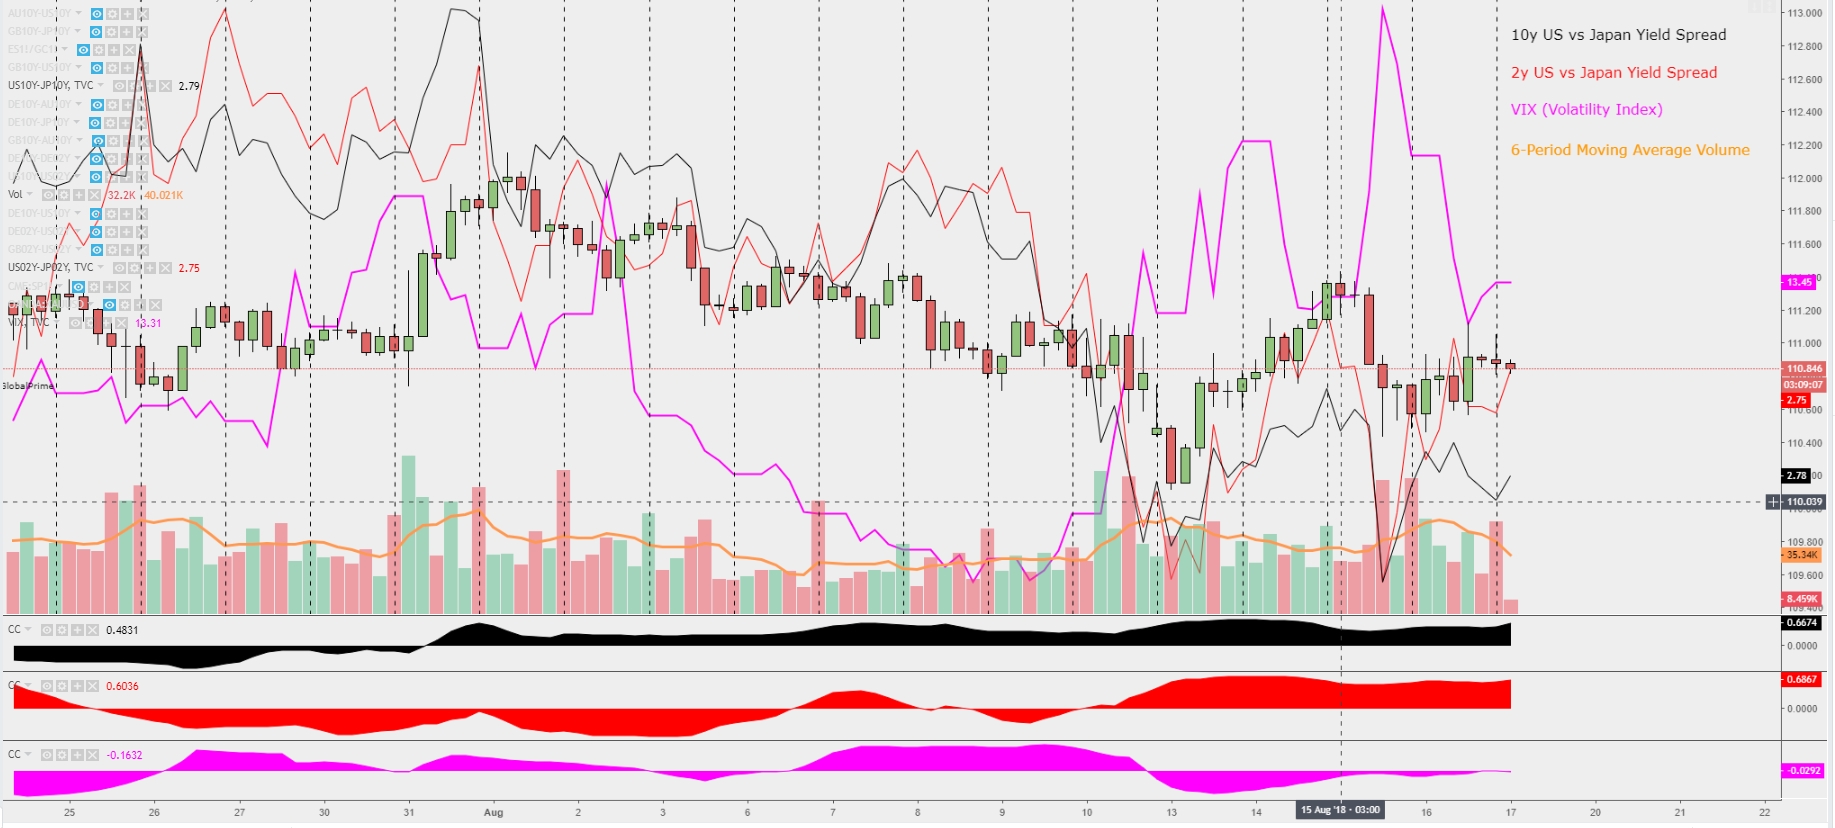
The recovery by the US Dollar is not carrying enough volume to challenge the heavy sell-side volume activity seen on Aug 15th, which should constitute a clue that suggests the upside should remain limited. In terms of price action, a strong buy-side bullish engulfing bar has been printed, although the close was far from ideal. The drop in the VIX and the recovery in the US vs JP bond yield spreads represent an anchor to support buy on dips nonetheless (the weekly and 3-month correlations are both very strong). With no economic data of significance in the US, expect rotational market conditions to ensue unless a fundamental catalyst emanating from the fluid situation in emerging markets, with Turkey and China at the epicenter.
Technicals and Levels (30m)
The upward price trajectory is starting to peter out, as price fails to find equilibrium above the critical 111.00 round number, with evidence of the supply imbalance found above clear after 2 failed breakouts. Even if the price were to extend further up, right overhead at 111.15 another important resistance will be encountered in the form of a horizontal line along with Aug 15th PoC (Point of Control), and origin of the supply imbalance seen this week. On top of that, the impulsive nature of the Aug 15th move, followed by the corrective nature of the recovery does not bode well from a price action perspective, as it communicates potential exhaustion. For sellers to regain control, 110.70-75 will have to first be retaken and market agrees on building value below, in which case 110.55 would be the next support ahead of 110.45, with a slide past this latter to expose a void area until the 110.10-100.00 is met.
AUD/USD: Constructive Structure w/Limited Upside
Volume, Price Action, Correlations, Fundamentals (H4)
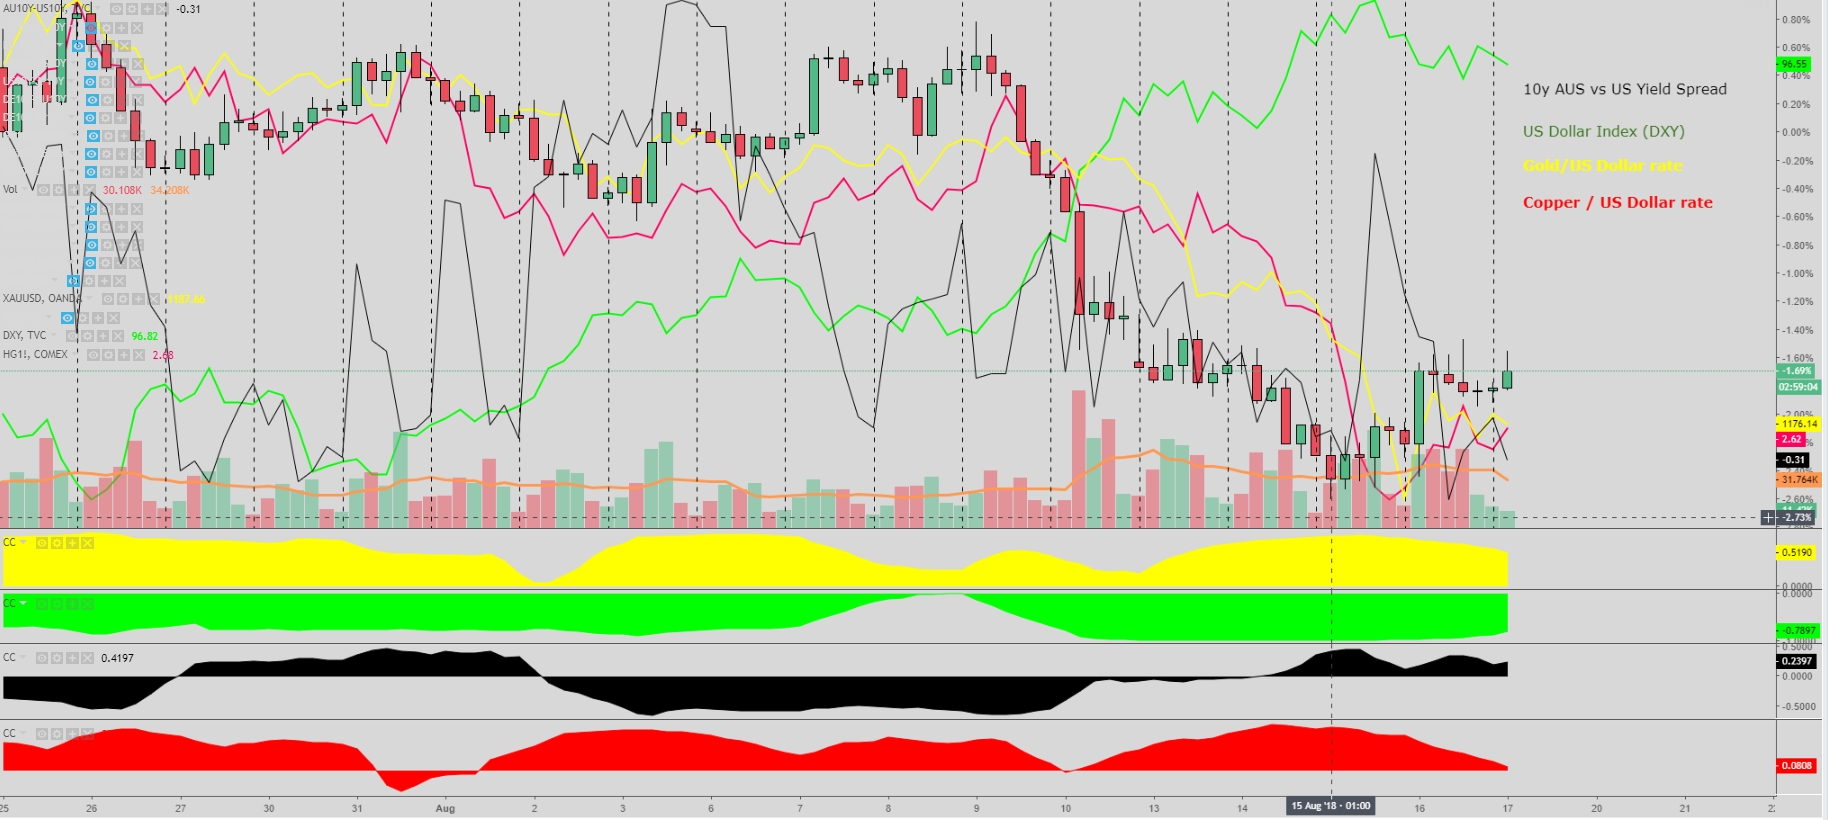
In terms of price action, the bullish engulfing bar post Aus jobs and China trade news is trying to unsuccessfully gain new traction, with the printing of a shooting star-type candle on high volume a first warning. So far, the retest into higher territory has seen volumes tapering, which is not a hint for a continuation. That said, it’s all about how the US Dollar will perform in the next 24h, as the market remains strongly inversely correlated to the DXY index. If further US weakness materializes, the Aussie looks set to benefit the most among G10 currencies. In the correlations front, it has tepid support from a mild pick up in copper and gold prices, while the Australian vs US 10-yr yield spread wanes, although the latter has failed to provide significant clues on the times it has diverged in recent months, so for now, takes a backseat.
Technicals and Levels (30m)
The technicals are definitely looking much more constructive in the short term, as the market finally finds a higher equilibrium level as per the formation of the PoC at 0.7270 as opposed to 0.7230 the previous day. The current dynamics entail a bullish first cycle up formed, with bids along 0.7250 so far holding the price and the bullish bias. As a caveat, even if the bullish bias extends, unless we see a major liquidation of USD longs heading into the weekend, the Aussie faces a sequence of nearby resistance layers on every 10-15p interval, which will make progress hard to come by. The toughest obstacle will no doubt be 7310, where the Aug 10th PoC intersects with the 200-hourly MA. To recap, to the upside, 7290, 73, 7310 are the three resistance to watch which should keep prices capped, while on the downside, a break of 7250 area exposes a renewed downside bias into 7210-7200 where commercials bids are expected to abound.
“Past performance is not a reliable indicator of future performance“
Important Footnotes:
The only Moving Averages to apply in the charts will be the 100 & 200-hourly exponential moving averages, which will assist us on the overall directional bias of the market.
The green, red, and aqua lines are utilized to represent the latest Cycles. Markets tend to move in cycles of 3 followed by a period of distribution and/or accumulation. To consider a cycle valid, we need to see a daily move greater than 75% of the 14-period average daily range.
The magenta rectangles in the chart represent the areas of most interest by trading volume, referred as POC – Point of Control –and should act as walls of bids/offers that may result in price reversals. The rectangles will be drawn as long as the area is not absorbed. The volume profile analysis tracks trading activity over a specified time period at specified price levels. The study reveals dominant and/or significant price levels based on volume. This process allows understanding market opacity.
The analysis of Volume activity in the chart provides some great insights into the actual buy or sell-side commitment to be engaged into a specific directional movement.
In the chart we representI ntraday or Macro Support/Resistance levels by drawing them in black colours, via a thinner black line for intraday support/resistance, while the macro levels of support/resistance will be drawn using a thicker black line.
In a thin blue line we will have the most recent Daily Highs and Lows, which play an important role as areas of support and resistance as well.
To reinforce the key area of interest in an attempt to find confluential levels, we will also use Daily Pivot Levels, which include the pivot point (thick orange) and the subsequent 3 levels of support and resistance derived from the pivot calculations.
The analysis will be conducted from a Top-Down approach by analyzing 2 timeframes. Firstly, we will look at the H4 chart to analyze the big picture, where attention centers around the price action, macro levels, volume analysis and valuations via yield spread. Secondly, we will break down the analysis from a technical perspective through the 30m chart by studying the most likely directional bias based on all the information gathered as well as the levels of major interest for traders.
The Ultimate Purpose of this report is to equip Global Prime’s existing and future clients with a professional institutional-level daily outlook that can assist one’s trading decisions on a regular basis.
Technical analysis is subject to Fundamental-led News. Any unexpected news may cause the price to behave erratically in the short term, while still respecting the most distant price references given.
EUR/USD: Market Looks Set to Stay Within Contained Range
Volume, Price Action, Correlations, Fundamentals (H4)
The recovery in the Euro/US Dollar rate was unimpressive to say the least, as bids found a large supply imbalance as 1.14 area got tested. The volumes and price action (shooting star and retest on low volume) are not supporting further climbs in the pair as it stands, especially in the context of a well-established downtrend. The slight uptick in long and short-dated German vs US bond yields may add some upward pressure with the correlation on a 3-month basis of a 3-day return being at the highest this year near 90%. While a source of imminent risk includes the elevated Italian bond yields (negative EUR), a temporary reprieve from highs, together with a higher Turkish Lira, adds to the case for the price to still find decent pockets of buy-side liquidity on dips, hence expecting bids to re-emerge to contain the downside. Overall, price action and volume are skewed to the downside but correlations appear supportive at the margin, therefore, unless new developments in China or Turkey and amid no data releases in Europe or US, range-trading might be on the cards this Friday, with top-bottom edges well defended.
Technicals and Levels (30m)
The corrective nature of the price action came to an abrupt halt at the test of the anticipated wall of offers circa 1.14, which represents the Aug 14th PoC and an area of value for the market. The impulsive move down from the top edge has led into a 5-legs intraday push being negated as the market appears to now enter a phase of consolidation, with the last 2 days failing to create any new cycle as per the magenta lines, which indicate not enough impulse in either direction. Based on the assumption that the contradictory indications between vol/price action and correlations will continue to hold true, and with Thursday’s PoC having found equilibrium in the middle of the range, an initial 0.5c range between 1.14 and 1.1350 might be expected, with the usual caveats of manipulation risks to take pockets of liquidity beyond these levels, which would represent a maximal extension of 1.1410-15 to the upside, while on the downside, 1.1330, which remains an untested PoC from Aug 15 should hold the potential selling tides.
GBP/USD:Sterling Saved by Weak USD, Remains Vulnerable
Volume, Price Action, Correlations, Fundamentals (H4)
The downtrend remains nonvolatile in the H4 timeframe, which continues to develop amid a bearish technical background as per the lower lows and lower highs. The latest price action, with a shooting star followed by a retest of higher levels on tapering volumes, is suggestive of a market prone to test lower levels. However, a weaker USD coupled with higher UK vs US yields spreads pose a risk to be overly short committed. Notwithstanding the pick up in yields, not that as in the case of spot Sterling, yield spreads have also been printing lower lows and lower highs, hence technically speaking there might be added pressure to be sent lower once again, in which case it may add to the bearish case. In terms of fundamentals, the recent UK retail sales is a positive input for the Sterling, with Friday’s calendar vacant.
Technicals and Levels (30m)
The chart is starting to exhibit much more choppy conditions, with the erratic non-directional behavior likely to extend as long as the US Dollar stays weak. The area of resistance between 1.2740 and 1.2760-70 (Aug 14th PoC) should see renewed selling interest to keep the overall downtrend dynamics valid, while on the downside, other than the usual pocket of liquidity at 1.27, expect 1.2690 ahead of 1.2670 to act as immediate support. The sterling stands as one of the most fragile currencies to see the downtrend resume, therefore the risk is by and large still to see sellers capping the upside while the downside continues exposed until the next significant macro support around 1.2620 is met.
USD/JPY: ‘Risk On’ Backdrop May Not Be Enough
Volume, Price Action, Correlations, Fundamentals (H4)
The recovery by the US Dollar is not carrying enough volume to challenge the heavy sell-side volume activity seen on Aug 15th, which should constitute a clue that suggests the upside should remain limited. In terms of price action, a strong buy-side bullish engulfing bar has been printed, although the close was far from ideal. The drop in the VIX and the recovery in the US vs JP bond yield spreads represent an anchor to support buy on dips nonetheless (the weekly and 3-month correlations are both very strong). With no economic data of significance in the US, expect rotational market conditions to ensue unless a fundamental catalyst emanating from the fluid situation in emerging markets, with Turkey and China at the epicenter.
Technicals and Levels (30m)
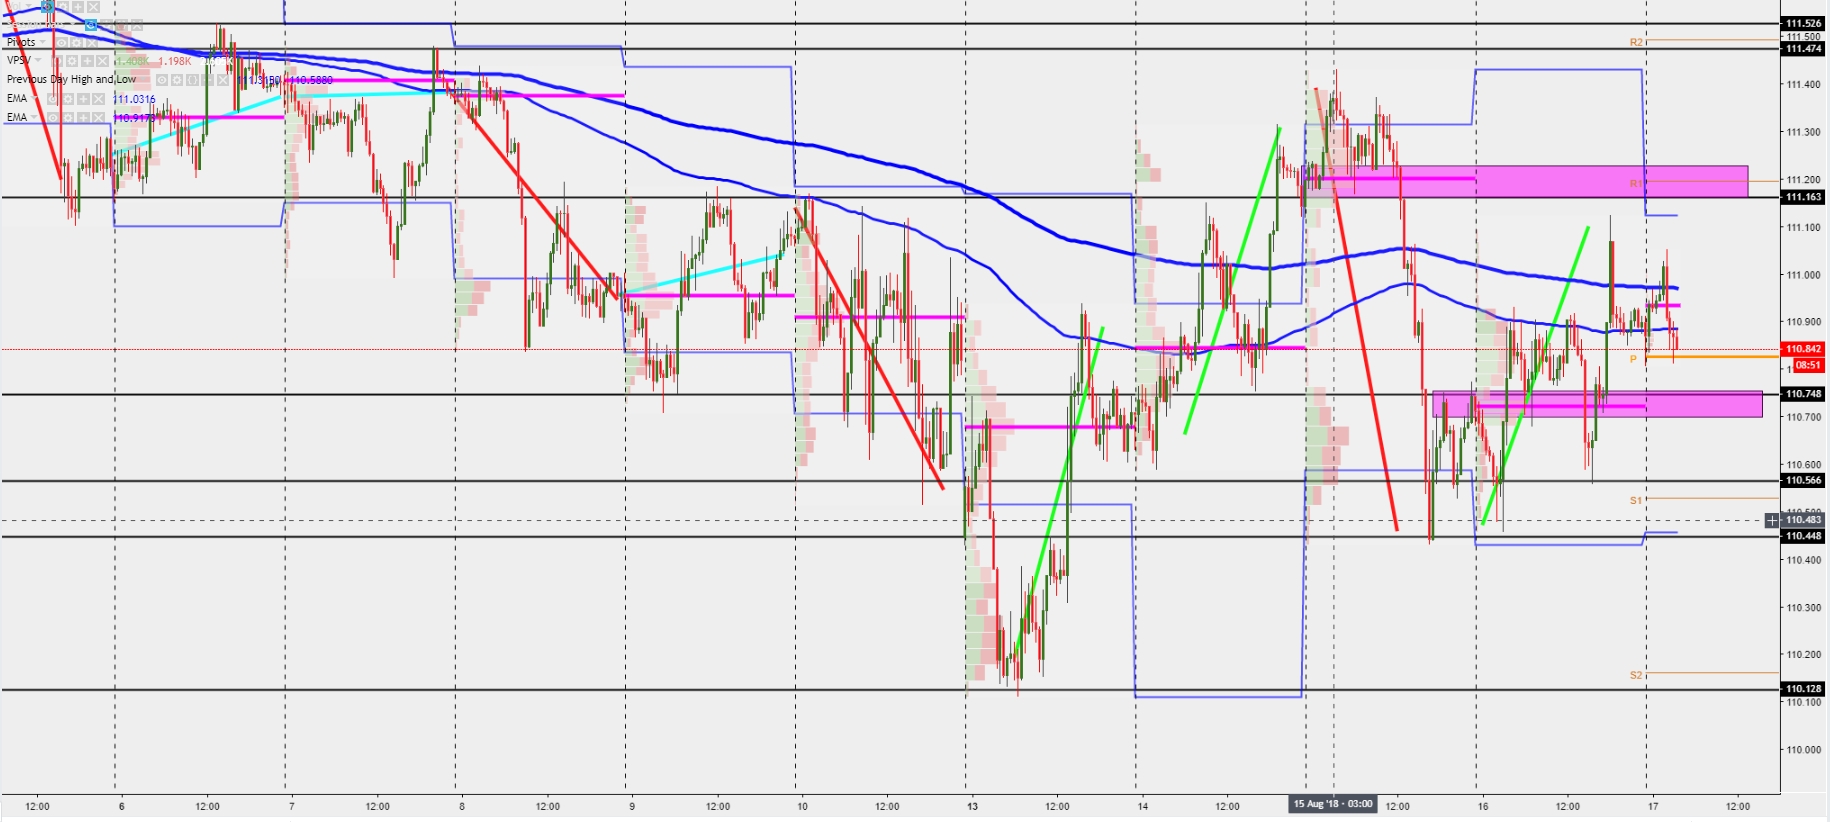
The upward price trajectory is starting to peter out, as price fails to find equilibrium above the critical 111.00 round number, with evidence of the supply imbalance found above clear after 2 failed breakouts. Even if the price were to extend further up, right overhead at 111.15 another important resistance will be encountered in the form of a horizontal line along with Aug 15th PoC (Point of Control), and origin of the supply imbalance seen this week. On top of that, the impulsive nature of the Aug 15th move, followed by the corrective nature of the recovery does not bode well from a price action perspective, as it communicates potential exhaustion. For sellers to regain control, 110.70-75 will have to first be retaken and market agrees on building value below, in which case 110.55 would be the next support ahead of 110.45, with a slide past this latter to expose a void area until the 110.10-100.00 is met.
AUD/USD: Constructive Structure w/Limited Upside
Volume, Price Action, Correlations, Fundamentals (H4)
In terms of price action, the bullish engulfing bar post Aus jobs and China trade news is trying to unsuccessfully gain new traction, with the printing of a shooting star-type candle on high volume a first warning. So far, the retest into higher territory has seen volumes tapering, which is not a hint for a continuation. That said, it’s all about how the US Dollar will perform in the next 24h, as the market remains strongly inversely correlated to the DXY index. If further US weakness materializes, the Aussie looks set to benefit the most among G10 currencies. In the correlations front, it has tepid support from a mild pick up in copper and gold prices, while the Australian vs US 10-yr yield spread wanes, although the latter has failed to provide significant clues on the times it has diverged in recent months, so for now, takes a backseat.
Technicals and Levels (30m)
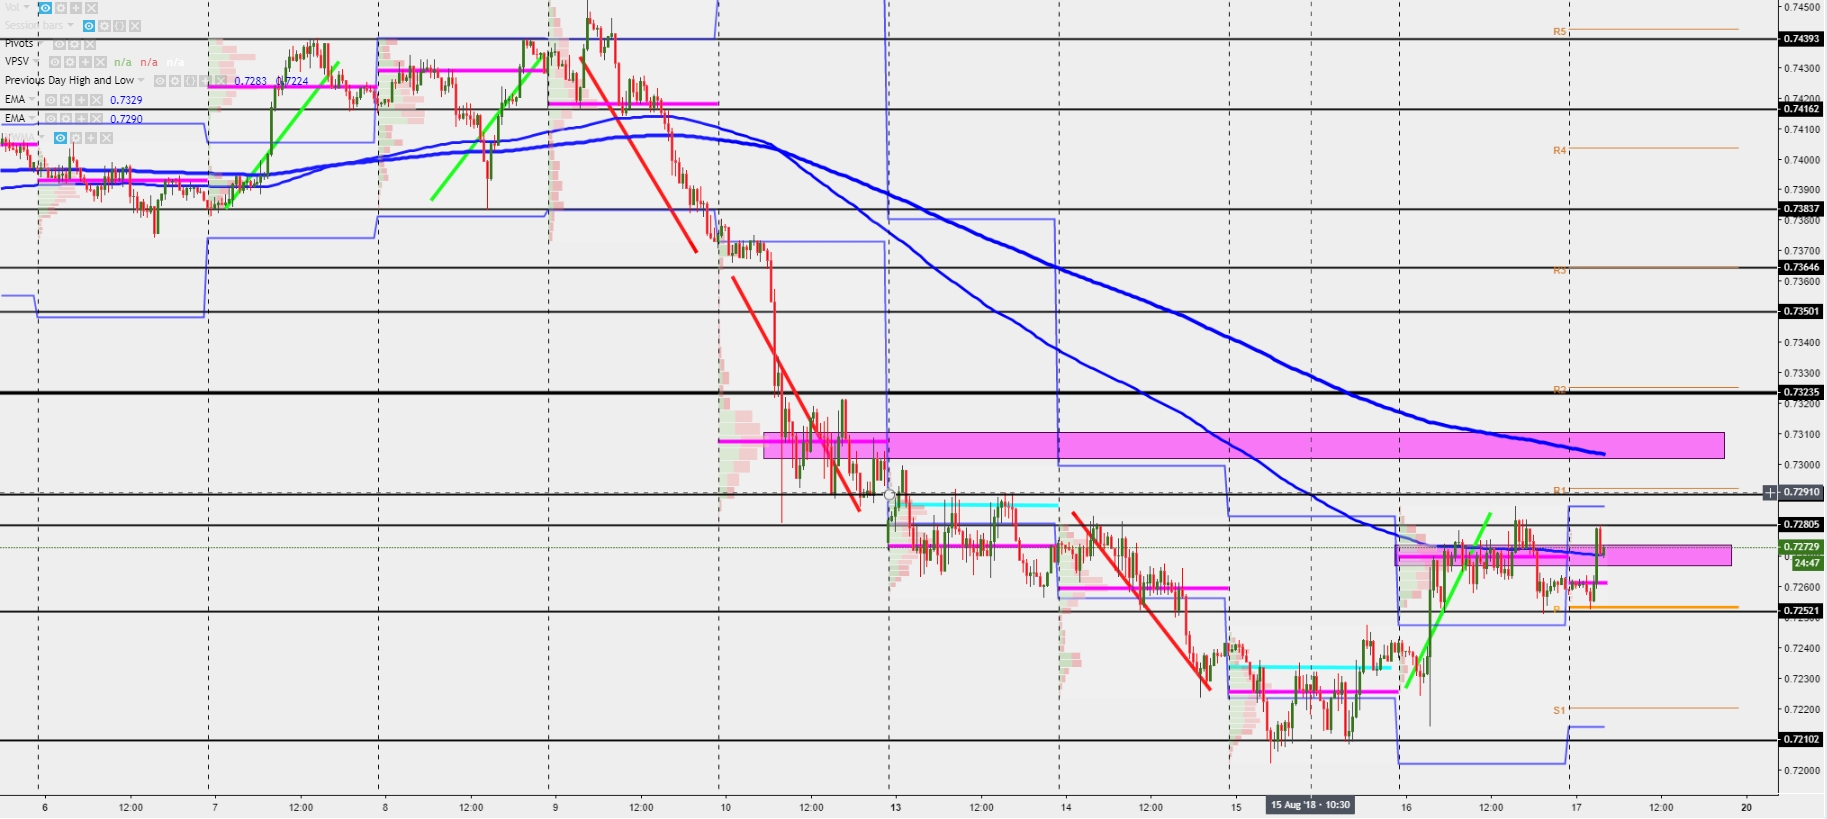
The technicals are definitely looking much more constructive in the short term, as the market finally finds a higher equilibrium level as per the formation of the PoC at 0.7270 as opposed to 0.7230 the previous day. The current dynamics entail a bullish first cycle up formed, with bids along 0.7250 so far holding the price and the bullish bias. As a caveat, even if the bullish bias extends, unless we see a major liquidation of USD longs heading into the weekend, the Aussie faces a sequence of nearby resistance layers on every 10-15p interval, which will make progress hard to come by. The toughest obstacle will no doubt be 7310, where the Aug 10th PoC intersects with the 200-hourly MA. To recap, to the upside, 7290, 73, 7310 are the three resistance to watch which should keep prices capped, while on the downside, a break of 7250 area exposes a renewed downside bias into 7210-7200 where commercials bids are expected to abound.
“Past performance is not a reliable indicator of future performance“
Important Footnotes:
The only Moving Averages to apply in the charts will be the 100 & 200-hourly exponential moving averages, which will assist us on the overall directional bias of the market.
The green, red, and aqua lines are utilized to represent the latest Cycles. Markets tend to move in cycles of 3 followed by a period of distribution and/or accumulation. To consider a cycle valid, we need to see a daily move greater than 75% of the 14-period average daily range.
The magenta rectangles in the chart represent the areas of most interest by trading volume, referred as POC – Point of Control –and should act as walls of bids/offers that may result in price reversals. The rectangles will be drawn as long as the area is not absorbed. The volume profile analysis tracks trading activity over a specified time period at specified price levels. The study reveals dominant and/or significant price levels based on volume. This process allows understanding market opacity.
The analysis of Volume activity in the chart provides some great insights into the actual buy or sell-side commitment to be engaged into a specific directional movement.
In the chart we representI ntraday or Macro Support/Resistance levels by drawing them in black colours, via a thinner black line for intraday support/resistance, while the macro levels of support/resistance will be drawn using a thicker black line.
In a thin blue line we will have the most recent Daily Highs and Lows, which play an important role as areas of support and resistance as well.
To reinforce the key area of interest in an attempt to find confluential levels, we will also use Daily Pivot Levels, which include the pivot point (thick orange) and the subsequent 3 levels of support and resistance derived from the pivot calculations.
The analysis will be conducted from a Top-Down approach by analyzing 2 timeframes. Firstly, we will look at the H4 chart to analyze the big picture, where attention centers around the price action, macro levels, volume analysis and valuations via yield spread. Secondly, we will break down the analysis from a technical perspective through the 30m chart by studying the most likely directional bias based on all the information gathered as well as the levels of major interest for traders.
The Ultimate Purpose of this report is to equip Global Prime’s existing and future clients with a professional institutional-level daily outlook that can assist one’s trading decisions on a regular basis.
Technical analysis is subject to Fundamental-led News. Any unexpected news may cause the price to behave erratically in the short term, while still respecting the most distant price references given.