The EUR/USD exchange rate is one of the world’s most traded currency pairings.
The charts used are from TradingView and the prices are from FXCM.
EUR/USD Forecast: Price recovers above 2010 low
EUR/USD is moving in a strong correction from the January high. From the low at the end of March, the price could recover and is now dealing with a possible resistance at the low from February 2021.
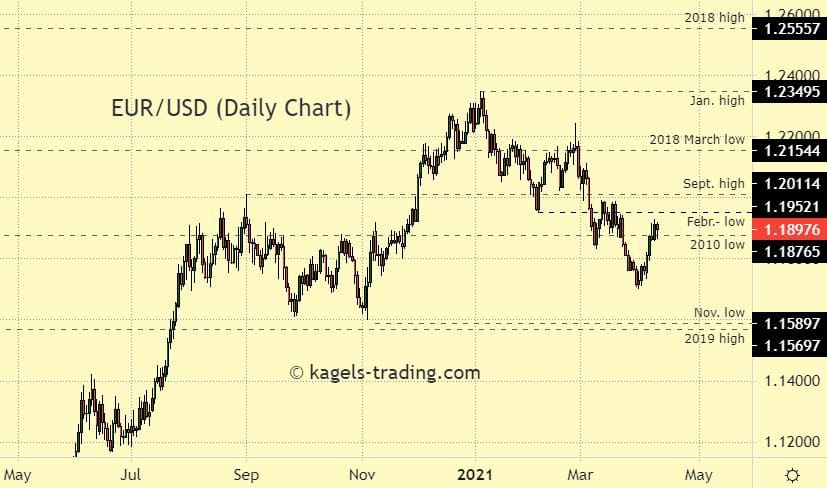
Resistance Levels: 1.1952 | 1.2011 | 1.2154
Support Levels: 1.1876 | 1.1704 | 1.1589
Forecast: The daily chart shows downside action. With prices above 1.1800 the chart looks neutral. We expect to see a broad sideways phase, as long as prices stay above the support area at 1.1600.
EUR/USD Forecast: Weekly chart recovers at around 1.1900
As a result of a progressive correction from the 2021 high, the EUR/USD fell to a local low at 1.1704. Last week the price recovered the mark of the 2010 low.
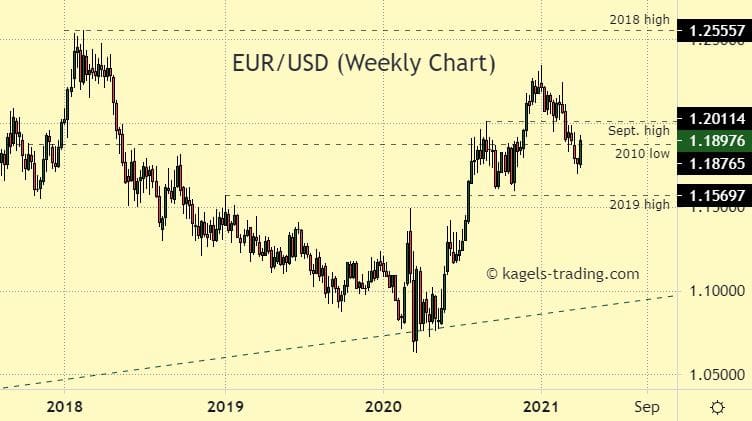
Resistance: 1.2011 | 1.2555
Support: 1.1876 | 1.1569
Forecast: On the weekly chart the focus is now on the current level of support at the low from 2010. Should the price be able to recover above the September 2020 high, expectations remain positive. A drop below 1.1600 could turn the neutral to positive outlook into negative.
Euro-Dollar Forecast: Monthly chart remains in the range of the previous candle
Euro-Dollar forex pair shows a weak candlestick in March dropping below 1.1800 price levels. April started positive and is dealing with the 2010 low.
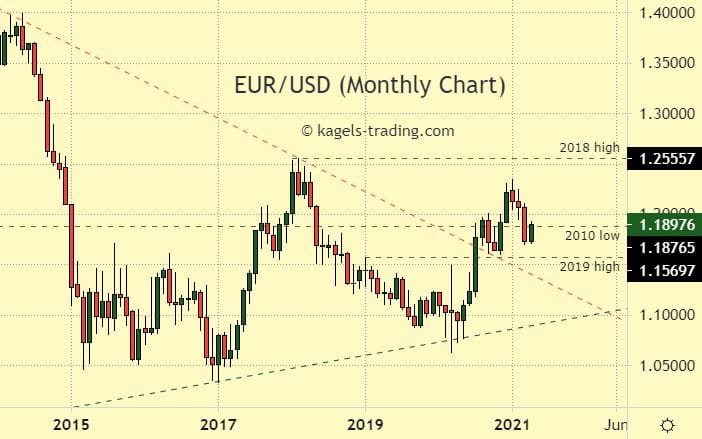
Resistance Levels: 1.2042 | 1.2555
Support: Levels: 1.1876 | 1.1569
Euro-Dollar Forecast: The monthly chart of EUR/USD shows weakness. A return above the 1.2000 area could turn the neutral outlook positive again. A drop below the 2019 high at 1.1569 would flip the neutral chart picture to negative.
EUR/USD Prediction: Quarterly Chart shows upside potential
Euro-Dollar forex pair is moving in the range of the previous candlestick at prices around 1.897.
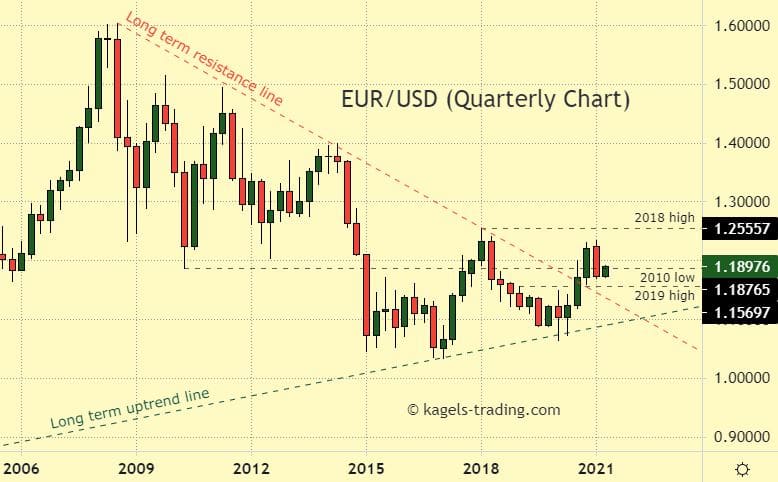
Resistance Levels: 1.2555
Support Levels: 1.1876 | 1.1569
EUR/USD Prediction: The quarterly chart of EUR/USD looks positive after breaking above the long term resistance line. A correction within the price range of the previous candle is underway, which may lead to sideways action. A drop below the 2019 high at 1.1569 could turn the neutral chart picture to negative.
Euro/Dollar Forecast: Yearly chart (Historical chart)
If we look at the yearly chart of the EUR/USD currency pair, we see a long-term downtrend that originated at the 2008 high at 1.6038. This could be terminated, because in the last six years EUR/USD is moving sideways in a big trading range. The long term uptrend line is mayor support which was successfully testet with the 2020 low.
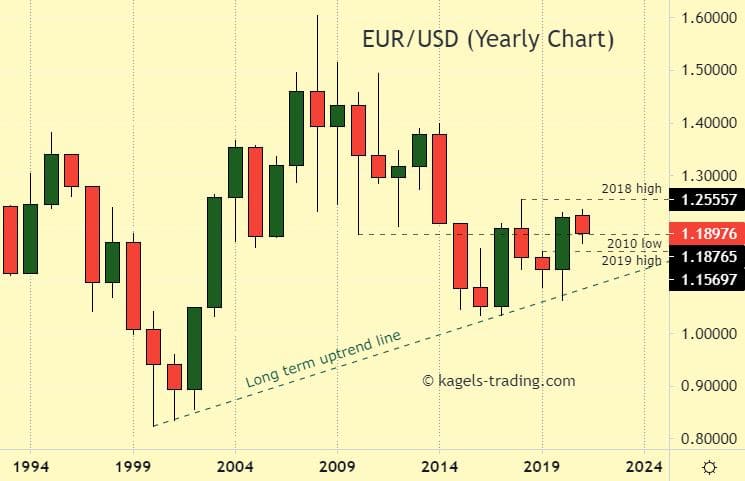
Resistance Levels: 1.2555
Support Levels: 1.1876 | 1.1570
EUR/USD Prediction: The yearly chart of EUR/USD looks neutral to slightly positive with strong support at 1.1570 (2019 high). We expect to see sideways action below the 2018 high at 1.2555.
*This price prediction is based on the data collected from various sources. This should not be considered as an investing parameter and user should do their own research before investing.
