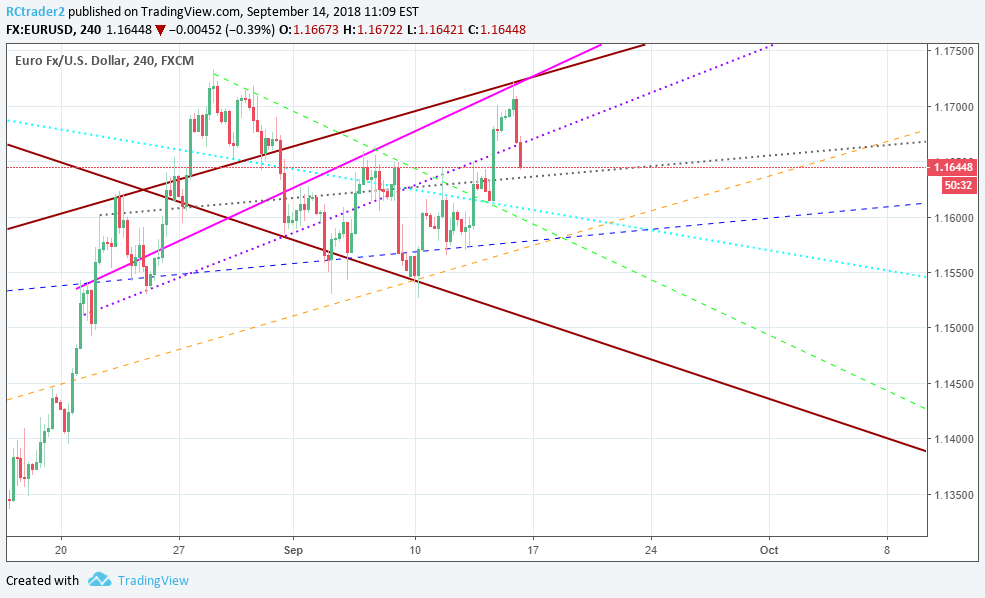
Forex is mathematical. If you know the algorithm it runs on then you are sleeping on a pile of gold. It appears the PA likes to bounce between trendlines, especially since it created a symmetrical triangle in the summer. This effect is a result of the mixed views that persist among traders in regards to the pair's exchange rate. It resembles a musical between bulls and bears.
EUR/USD's price made a top at ~1.1722 during the EU session earlier Today. It mirrors a double top together with the previous higher high at ~1.1734 on the 4h chart. It also touched the upper limit of the expanding triangle it tries to sketch. Thus, it should be headed now towards the lower limit of the triangle. But on the way, there are key trendlines it could dance on.
The first line one has to look at is the violet one which will put resistance in the event the price attempts to move back up. The second line is the gray one which could define Today's low. The third line is the teal one which will provide temporary support sometimes next week as it is the upper limit of the previous triangle.
The other 3 lines that will act as support and resistance are the orange, blue and green that alike the previous ones intersect in the same place. Right through that intersection, an extended dip could happen and so bring the price onto the lower limit of the triangle.
One last element to be taken into consideration is the bearish divergence on the 1h chart that has yet to develop on the 4h chart. Odds are for a hidden one.

