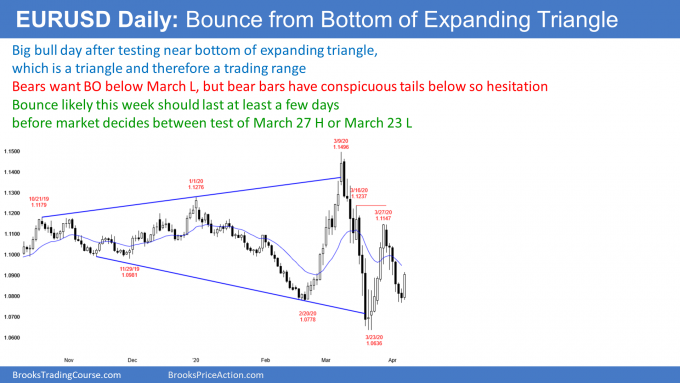
The daily chart of the EUR/USD forex market rallied strongly overnight after a 6 day selloff. The selloff was a test of the top of the March 23 buy signal bar and the February 20 low. Also, it was a pullback from the strong rally to the March 27 high. At a minimum, the rally should reach the 20 day EMA and a 50% pullback.
The bounce and the context are good enough for traders to expect at least of few days of sideways to up trading. They will then decide between a test of the March 27 high and the March 23 low.
Trading ranges resist breaking out. Furthermore, they spend a lot of time in the middle third of the range. This 7 month expanding triangle is a triangle. A triangle is a trading range. Consequently, it is more likely that the EUR/USD will be sideways to up for at least a couple weeks.
Overnight EUR/USD Forex trading
The 5 minute chart of the EUR/USD Forex market rallied relentlessly overnight. However, it went sideways for a few hours until an hour ago. That trading range might be a magnet later today. But, the downside is probably not big since the context is good for the bulls on the daily chart.
Because the overnight pullbacks have been small, traders have mostly been buying. The body on the daily chart is now approximately the same size as the other big bodies over the past 2 weeks. There is probably not much left to the bull trend today.
The 20 day EMA is a magnet and it is just above the day’s high. If the bulls decide that the day will not become much bigger, they will switch to buying pullbacks instead of buying at the market. Also, they will take profits near the high of the day.
Once the bears see that, they will begin to sell rallies down from the high for 10 – 20 pip scalps. Day traders should expect the strong bull trend to evolve into a trading range soon. However, the reversal up is strong enough to create a bullish bias for a few days.
