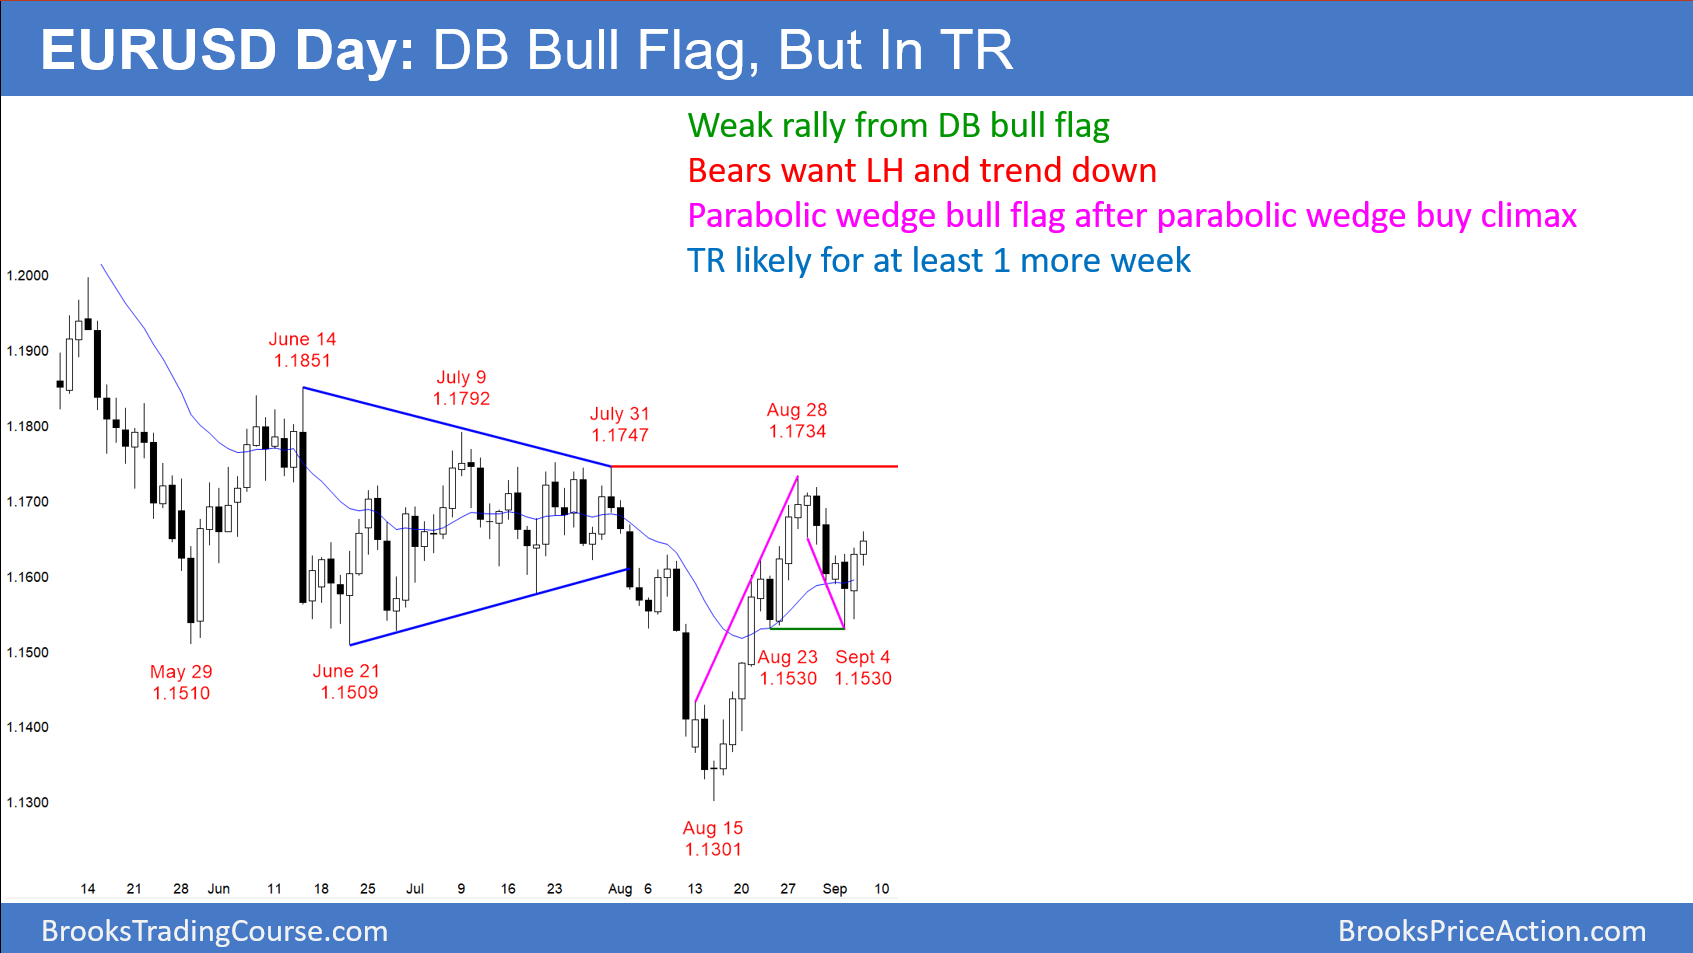
The EUR/USD daily Forex chart is rallying from a double bottom bull flag at the 20 day EMA. However, this follows a parabolic wedge buy climax and it is in the middle of a 5 month trading range.
The EUR/USD daily Forex chart is rallying for a double bottom bull flag at the 20 day EMA. However, the parabolic wedge buy climax that ended August 28 is likely to have a 2nd leg sideways to down. In addition, the parabolic wedge bull flag that ended Tuesday was a tight bear channel. It therefore will likely lead to more sideways trading.
Consequently, while the bulls took control on August 15, the odds favor at least another week in the 5 month trading range. Since trading ranges resist breaking out, the daily chart may stay sideways for many weeks.
Markets often have symmetry. The daily chart was sideways for 3 months before the August 15 bull trend reversal. While unlikely, the trading range might continue for another 3 months before the bulls get their breakout.
Overnight EUR/USD Forex trading
The EUR/USD 5 minute chart rallied 40 pips overnight, but most of the bars were small and had prominent tails. This looks more like a bull leg in a trading range than a resumption of a bull trend. Day traders will therefore continue to scalp until there is a strong breakout up or down.
Since there is support at the 1.1530 double bottom, the bulls will look for a swing trade up from that level. The bears correctly expect that this rally will form a lower high. They will therefore look for a 1 – 3 day reversal down starting today or tomorrow.
