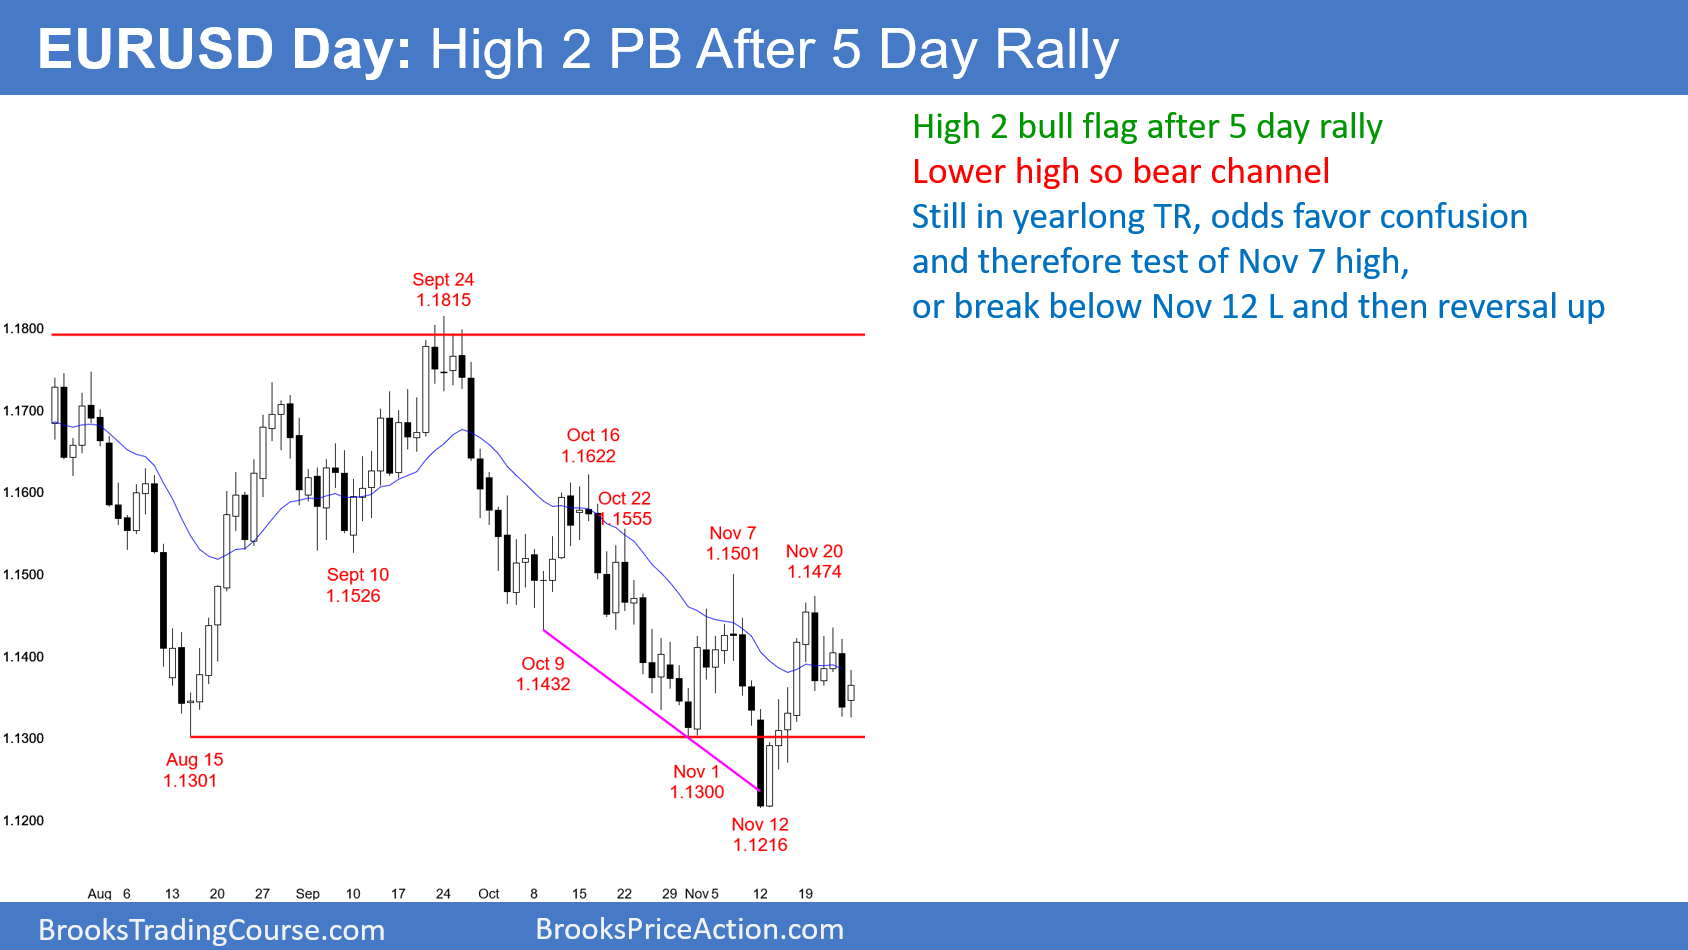
The EUR/USD daily chart pulled back for 2 legs after a strong 5 day rally. The odds are that this High 2 bull flag will lead to a breakout above the November 20 lower high.
The EUR/USD weekly Forex chart (not shown) triggered a sell signal overnight by trading below last week’s low. As I wrote over the weekend, even though last week was a strong sell signal bar on the weekly chart, there might be more buyers than sellers below. Last night traded only 1 pip below last week’s low and reversed up. This is a sign that the bulls might be more aggressive at this level than the bears.
On the daily chart above, the past 5 days formed a 2 legged pullback from a 5 day rally. Since the November selloff was a wedge, the odds are that there will be a 2nd leg up. Moreover, the bulls will probably be able to break above at least one minor lower high in the bear channel. Consequently, the EUR/USD daily chart should get above the November 20 high this week.
If so, the bar on the weekly chart would be an outside up bar after a strong sell signal bar. Thar would create trapped bears. This week would then be a buy signal bar on the weekly chart for next week. At the moment, the chart will probably go above the October 16 high before it falls below the November 12 low.
Overnight EUR/USD Forex trading
The EUR/USD 5 minute Forex chart rallied 60 pips overnight after reversing up from below last week’s low. While the rally has not been especially strong, the context is good for the bulls on the daily and weekly charts. Consequently, traders will look to buy pullbacks and strong breakouts, hoping for a continued rally this week.
Because the rally so far has not been strong, day traders will also be willing to sell reversals down for a scalp. Unless there is a strong break below the overnight low, most bears will not swing trade.
However, if they break below the overnight low, they will trigger the weekly sell signal again. The bulls will give up their hope of an outside up week. That would increase the odds of a failed High 2 bull flag on the daily chart. Traders would then look for a break below the November 12 low.
