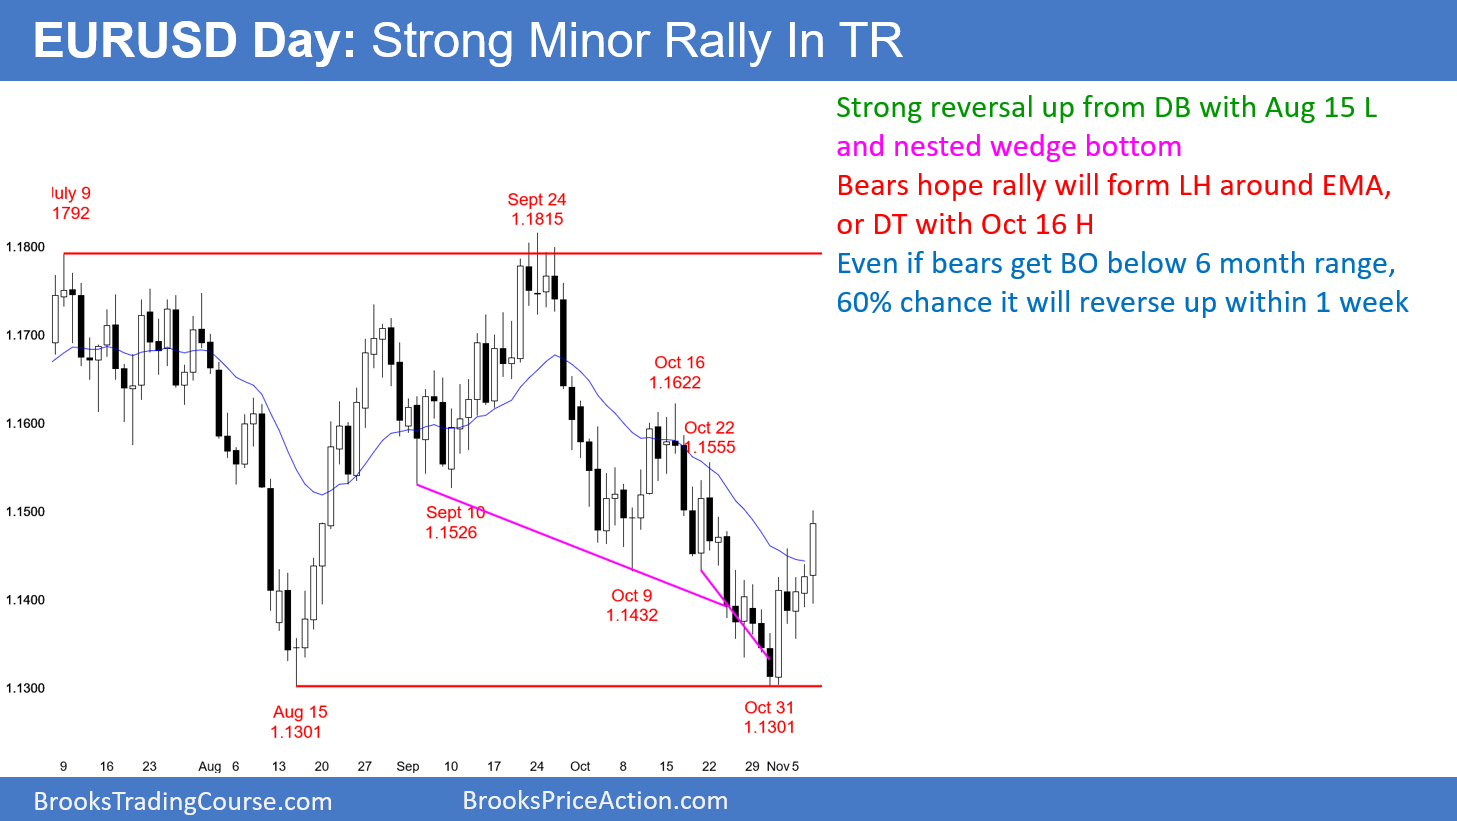
The EUR/USD daily Forex chart has rallied for 5 days after a nested wedge bottom. Because the October selloff was in a tight bear channel, this rally is probably a minor bull trend reversal.
The EUR/USD daily Forex chart has a big bull trend day so far today. The bulls want today to close above Friday’s lower high. They then would view today as a measuring gap. The measured move would be around the 1.16 Big Round Number and the October 16 major lower high.
The bears always want the opposite. They therefore want today to close below Friday’s high. That would increase the odds of a 2 – 3 day pullback. Because the 5 day rally has been strong, the bulls will probably buy the 1st leg down. Consequently, the bears will probably need at least a micro double top if they are to break below the August/October double bottom.
So far, this rally has lacked consecutive big bull bars. If today closes below Friday’s high or if tomorrow has a bear body, there will probably be a 100 pip pullback within a week. Alternatively, if today closes on its high and tomorrow has a bull body, the rally will probably go up to the October 16 high with only 1 – 2 day small pullbacks.
EUR/USD Forex daily chart still in 6 month trading range
Even though the bulls are reversing up from a 2 month double bottom, the rally is within a 6 month trading range. It is therefore more likely just another leg in the range rather than the start of a bull trend. Consequently, the bulls will probably only be able to maintain control for a few weeks before the bears regain control for 2 – 3 weeks. There is nothing to indicate that this is about to change.
EUR/USD Forex weekly chart has minor buy signal
By going above Friday’s high, which was last week’s high, the EUR/USD weekly chart triggered a buy signal. However, the buy signal bar was just a doji bar and the 6 week selloff was in a tight bear channel. This is a weak buy setup. Consequently, the rally will probably only last 1 – 2 more weeks before the chart begins to go sideways. This is consistent with the daily chart, which will probably pull back for several days within a week.
Overnight EUR/USD Forex trading
After rallying 70 pips overnight, the EUR/USD 5 minute Forex chart has been sideways for 4 hours. The key price today and tomorrow is Friday’s high of 1.1458. The chart is now 25 pips above it. The bulls want both days to close above it, and the bears want one or both days to close below it.
A close above increases the odds of several more days straight up. Because the daily chart is in a trading range, it is more likely that there will be a close below today or tomorrow. This is because trading ranges repeatedly disappoint bulls and bears who are hoping for strong trends.
The rally should continue up to the October 16 major lower high above 1.16 within 3 weeks. But, because the daily chart is in a trading range, the 5 minute chart will spend a lot of time in trading ranges as well. The bulls hope that the 4 hour trading range is a bull flag and that there is a late rally today. More likely, the range will continue, or there will be a minor reversal down to Friday’s high.
