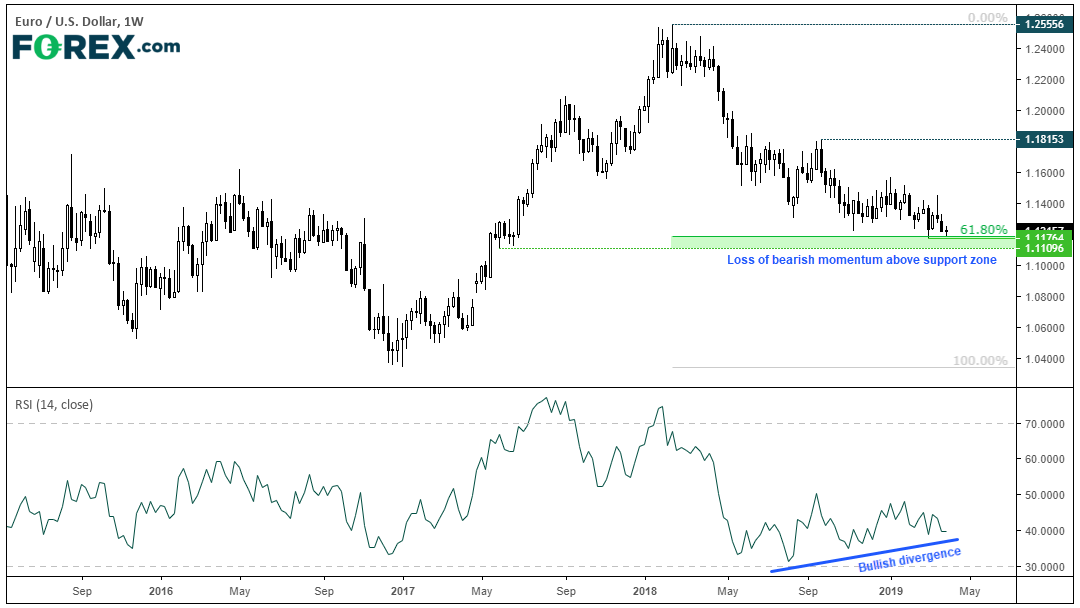
In recent sessions, EUR/USD has drifted down towards long-term support. Given we’ve not seen a weekly close beneath 1.1200 in 21-months and the daily timeframe is looking stretched, a bounce from current levels is not out of the question.

We can see on the weekly chart that, since the 2018 high, bearish momentum has waned and created a bullish divergence with RSI. Furthermore, the recent lows around 1.1200 coincide with a 61.8% Fibonacci level. Still, as we’re dealing with a long-term chart we should allow for noise around these technical levels but, even if it were to break lower, structural lows sit around 1.1100 which make the reward to risk ratio undesirable for shorts (on the weekly chart).
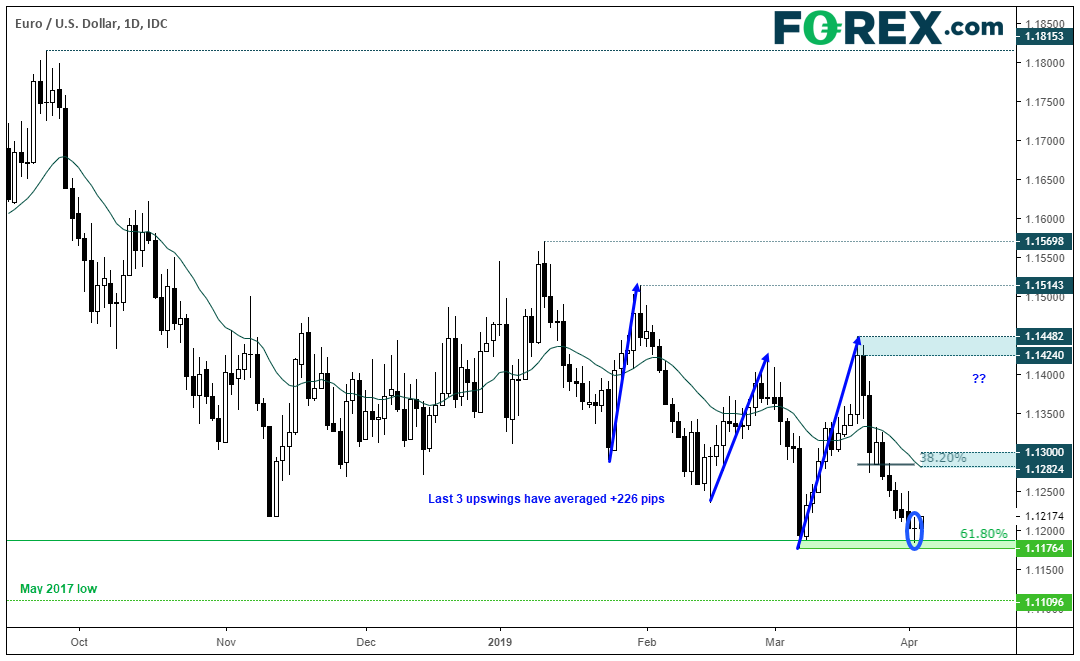
Taking a closer look at the daily chart, a small gravestone respected the support zone after an extended run lower. Also note that, overall, volatility of the bearish candles has diminished as prices approached support. This leaves the potential for prices to mean revert. A zone of resistance sits around 1.1282 – 1.1300 area (which comprises of the 20-day eMA, 38.2% Fibonacci level and 1.13000 round number). However, given the last three upswings have averaged around 224 pips, EUR/USD could rebound towards the 1.1400 handle if this price action characteristic holds.

If prices break lower this week, it’ll be interesting to see if prices can remain beneath 1.1200 into the weekly close to break euro’s 21-month streak above 1.1200. But, given the stretched nature of price action and respect of current support levels, we suspect a minor bounce at the least is the more probable outcome.
