
EUR/USD:Buyers Exploit USD Miseries, Buy Dips Favored
Volume, Price Action, Correlations, Fundamentals (H4)
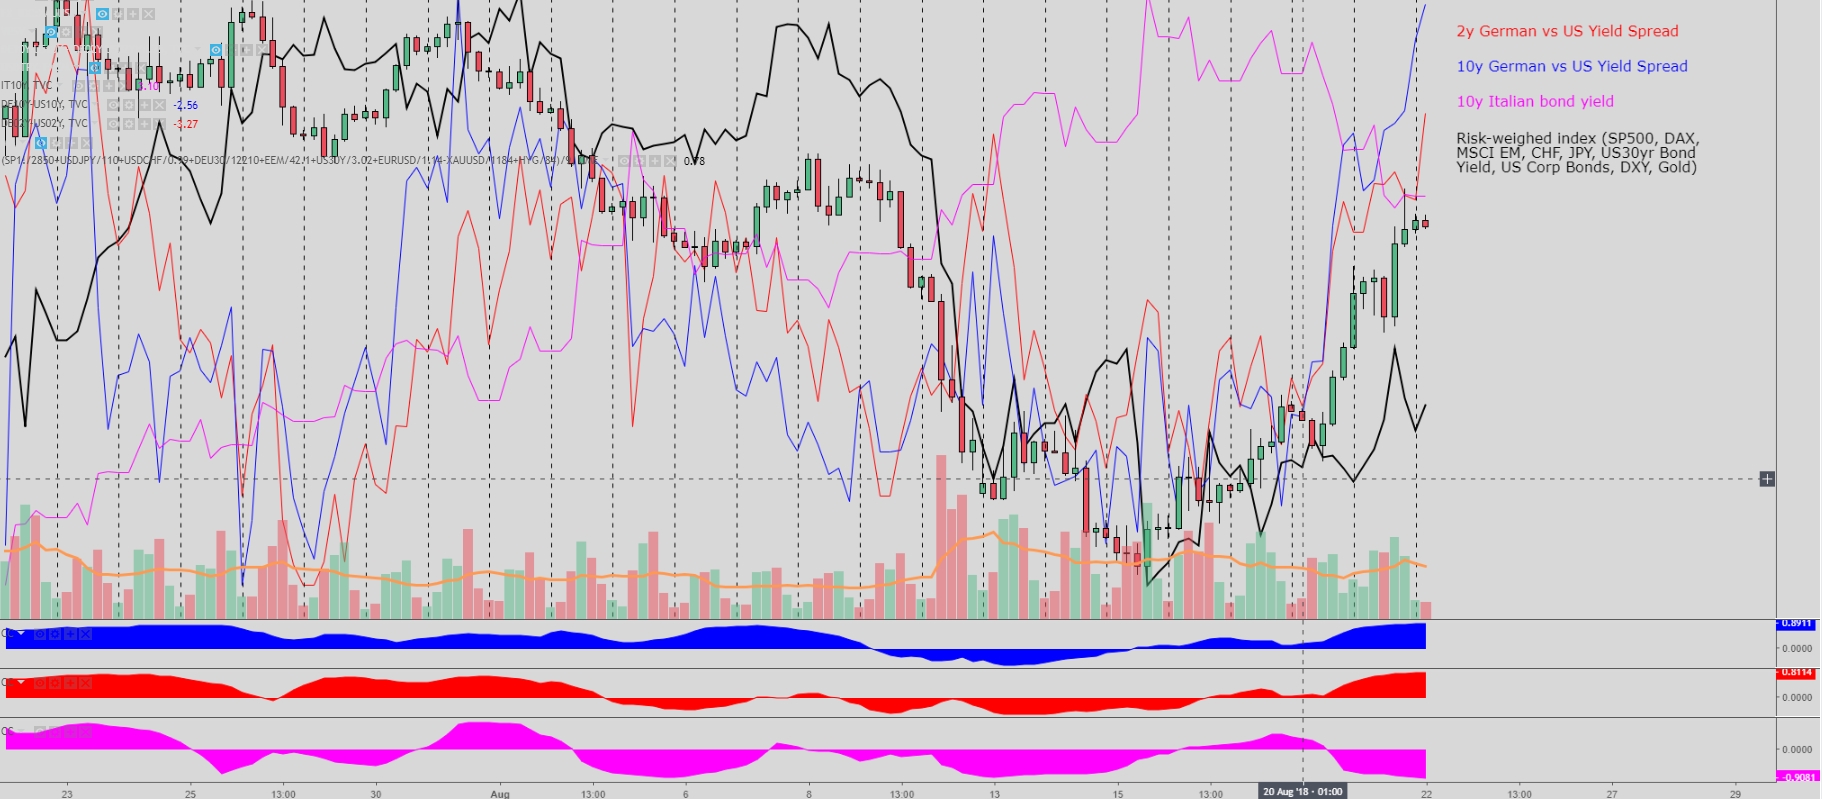
The quadfecta of events points towards a market that is well controlled by buyers. In the last 24h, volumes have been rising on what’s an unambiguous strong move up, with the close near the highs of the day by NY 5 pm communicating that selling tendencies are fading. Price action is also very bullish, with the highest volume of the day a commanding buy-side candle with a neat high close. Meanwhile, correlations with German vs US yield spreads are screaming that the focus is shifting towards the upside short term, as the Turkish Lira and Italian bond yield cause no concern for now, amid relative stability in valuations. Besides, the risk-weighted index is supportive of the move higher too. The news that Trump’s former lawyer has testified to have violated campaign laws during the Trump run up for President should weigh on the US Dollar. If one factors in the low risk of today’s FOMC event acting as a risk for the market or the Chinese vs US trade talks for that matter, the conclusion is that the path of least resistance for the pair continues to be to the upside.
Technicals and Levels (30m)
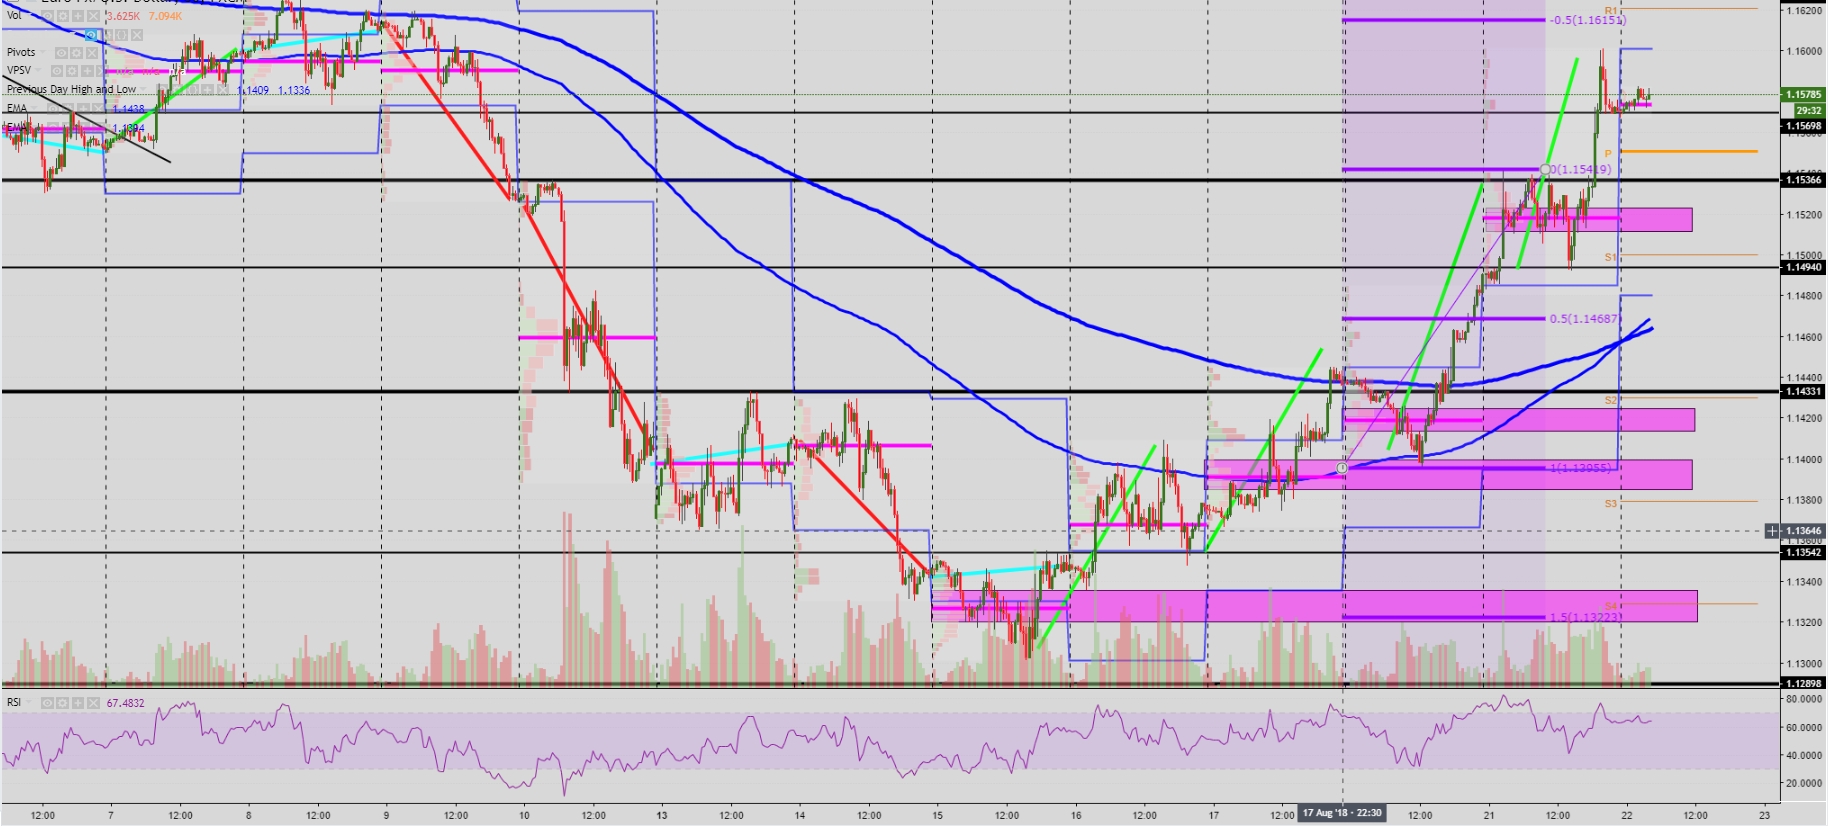
At the current rate of appreciation and with another successful leg higher, it looks as though the next potential target for buyers is set circa 1.1630 (around the 100% fib proj). Momentum players have been piling up to exert major pain into wrong-sided USD buyers and the technicals, while overstretched judging by the RSI (starting to signal a divergence), there are no signs of a turnaround in the current bullish tide. 1.1535 down to 1.1520 are the best value levels to reinstate longs, while shorts are likely to await for better price levels starting from 1.1630. It will take a consolidation phase sub 1.1520 for the technicals to start shifting the focus back down, a scenario not expected in the next 24h.
GBP/USD: Improved Bullish Outlook, Plays EUR Catch Up
Volume, Price Action, Correlations, Fundamentals (H4)
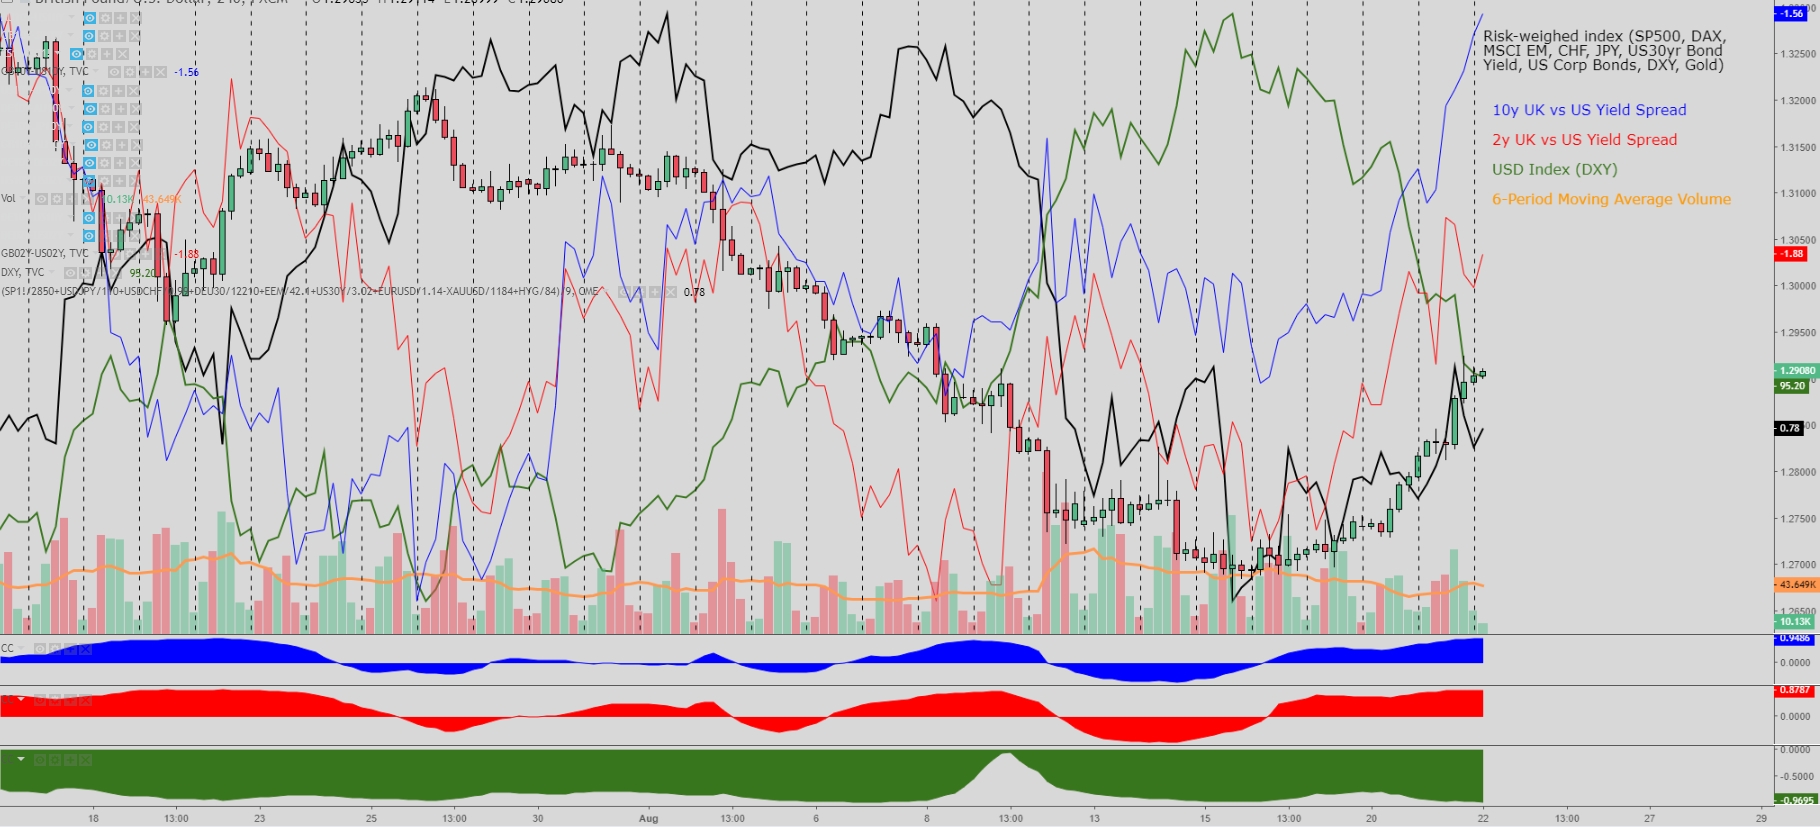
A very similar picture in the Pound. Increasing volumes on the way up, bullish price formations on the 4h chart, a boost in the UK vs US 10s and 2s bond yields amid a battered USD and renewed optimism around a Brexit deal after a joint EU/UK press conference on Tuesday, are all elements underpinning the upside. What’s more, there are no risk events that may damage the positive outlook in technicals during European hours, with the exception of potential headlines between the US and China on trade talks kick-starting today and the FOMC minutes late in the US.
Intraday Technicals (30m)
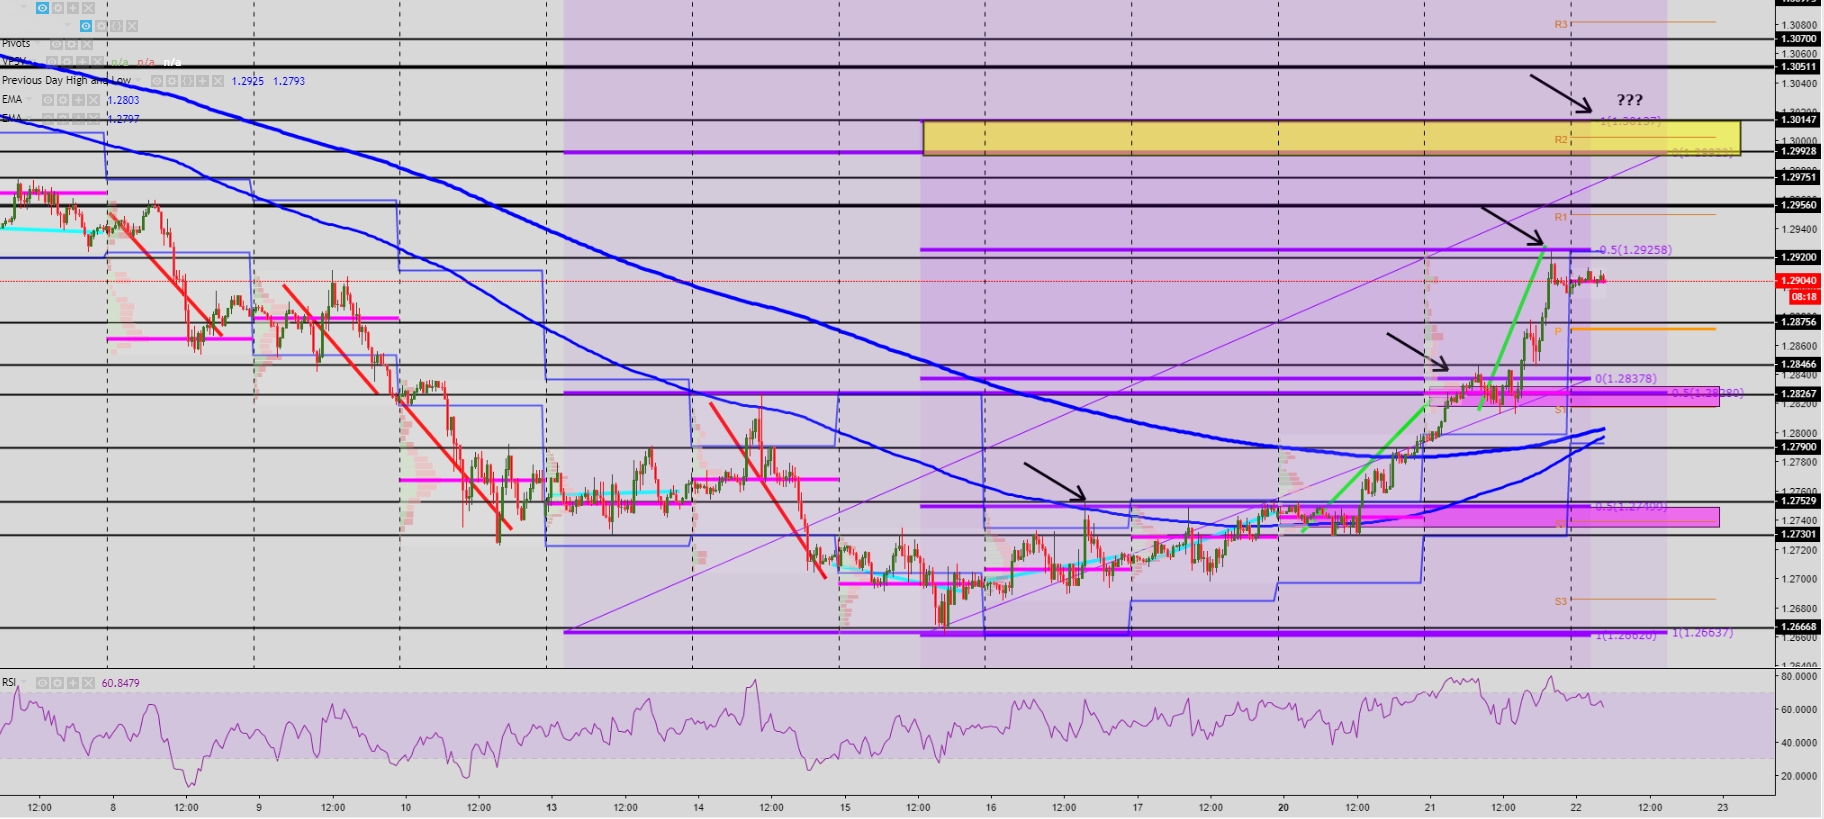
An undeniably bullish technical outlook for the Sterling, which should find plenty of bids on retracements, especially after the slightly more constructive outlook for a Brexit deal later this year. The fib proj targets continue being reached to the upside, suggesting that if buyers were to keep the control of price as it looks set to be, the next target is set just above 1.30. Note, before reaching such hefty levels, a major macro resistance around 1.2950 must be breached. To the downside, buy on dips strategies around 1.2875 ahead of 1.2845-50 area and 1.2830 (PoC Tuesday) are expected. At the current levels, and while the RSI is yet to signal a divergence, it’s getting riskier for the average individual trader or auto system to engage in buy-side action unless being short-term in nature and managing positions on tight stops.
USD/JPY: Muddier Picture w/Sellers Still More Dominant
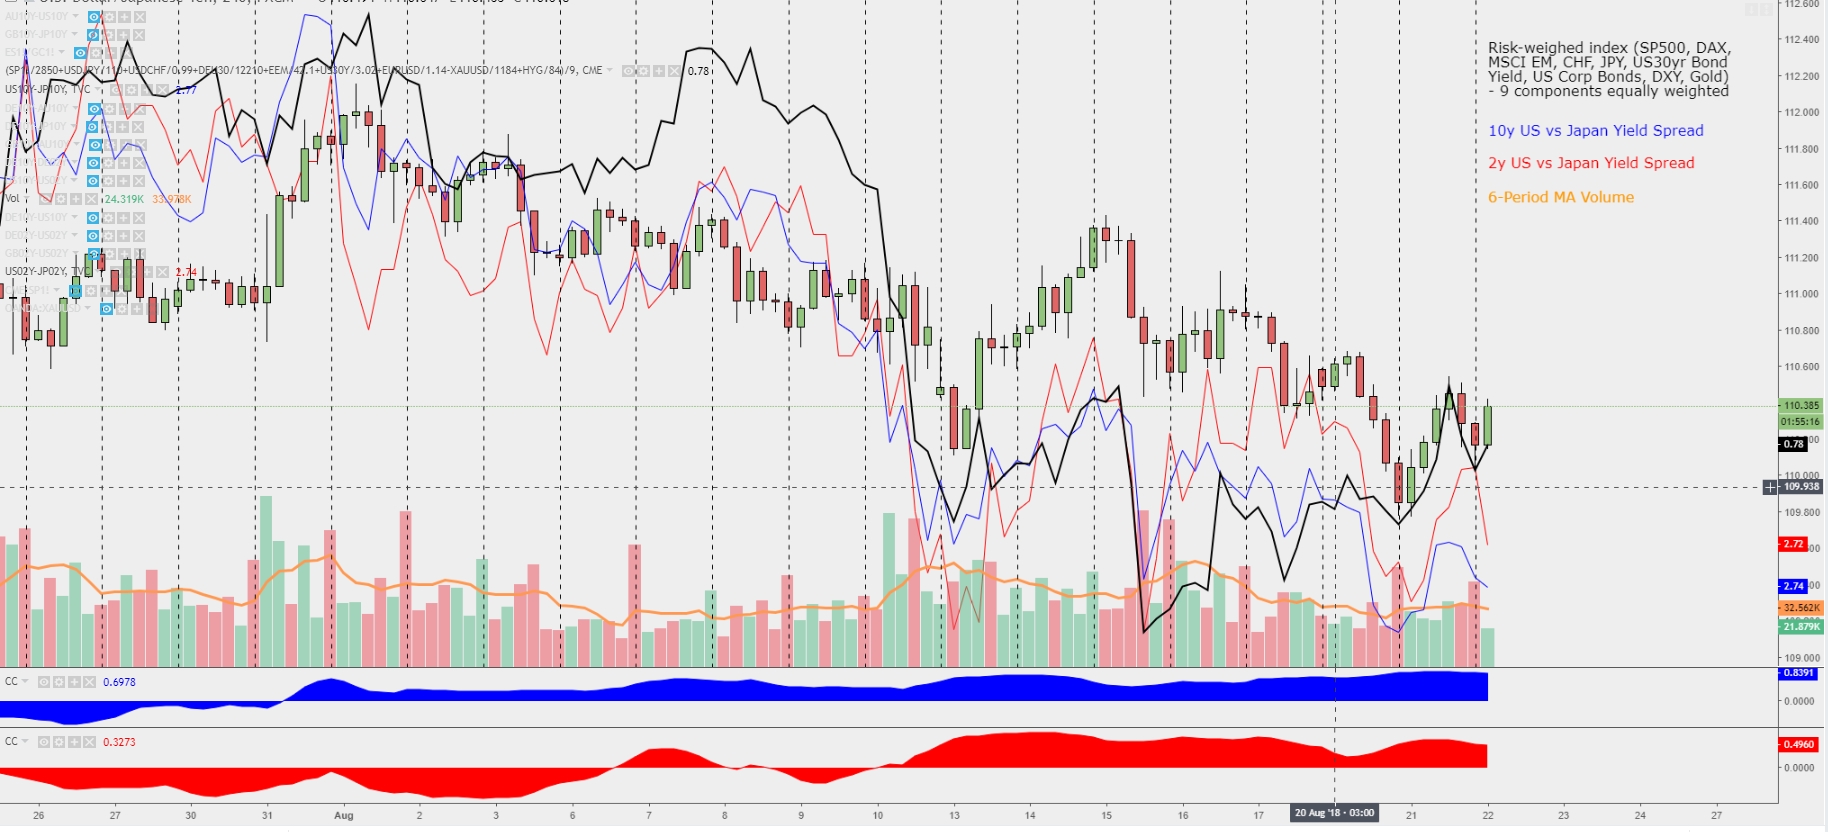
Volume, Price Action, Correlations, Fundamentals (H4)
An inconclusive picture as volume headed higher tapering off before a pick up in sell-side activity, especially as news of Cohen testifying against Trump were made public, hurting the USD outlook in the process. The clues obtained via a correlation analysis reveals that the pair, despite being weighed down by the domestic political issues, is still likely to find buyers on dips due to a rising risk-weighted index with also a slight tick up in US vs JP bond yields. However, the outlook remains much muddier than the clear bullish signals in EUR/USD or GBP/USD, as the Yen must still combat a dominant ‘risk on’ environment in the near term, which caps flows into the currency. Note, the fluid situation in the US, which has already seen its repercussions on a sharp decline in the SP500, can easily see risk aversion return to the forefront. Following up new developments on the US political landscape, headlines on the US vs China trade talks and the FOMC minutes will be critical to stay in tune with the latest flows in this market today, and will contribute directly to dictate the next bias for the pair. For now though, as said, the daily changes are still not suggesting a clear direction.
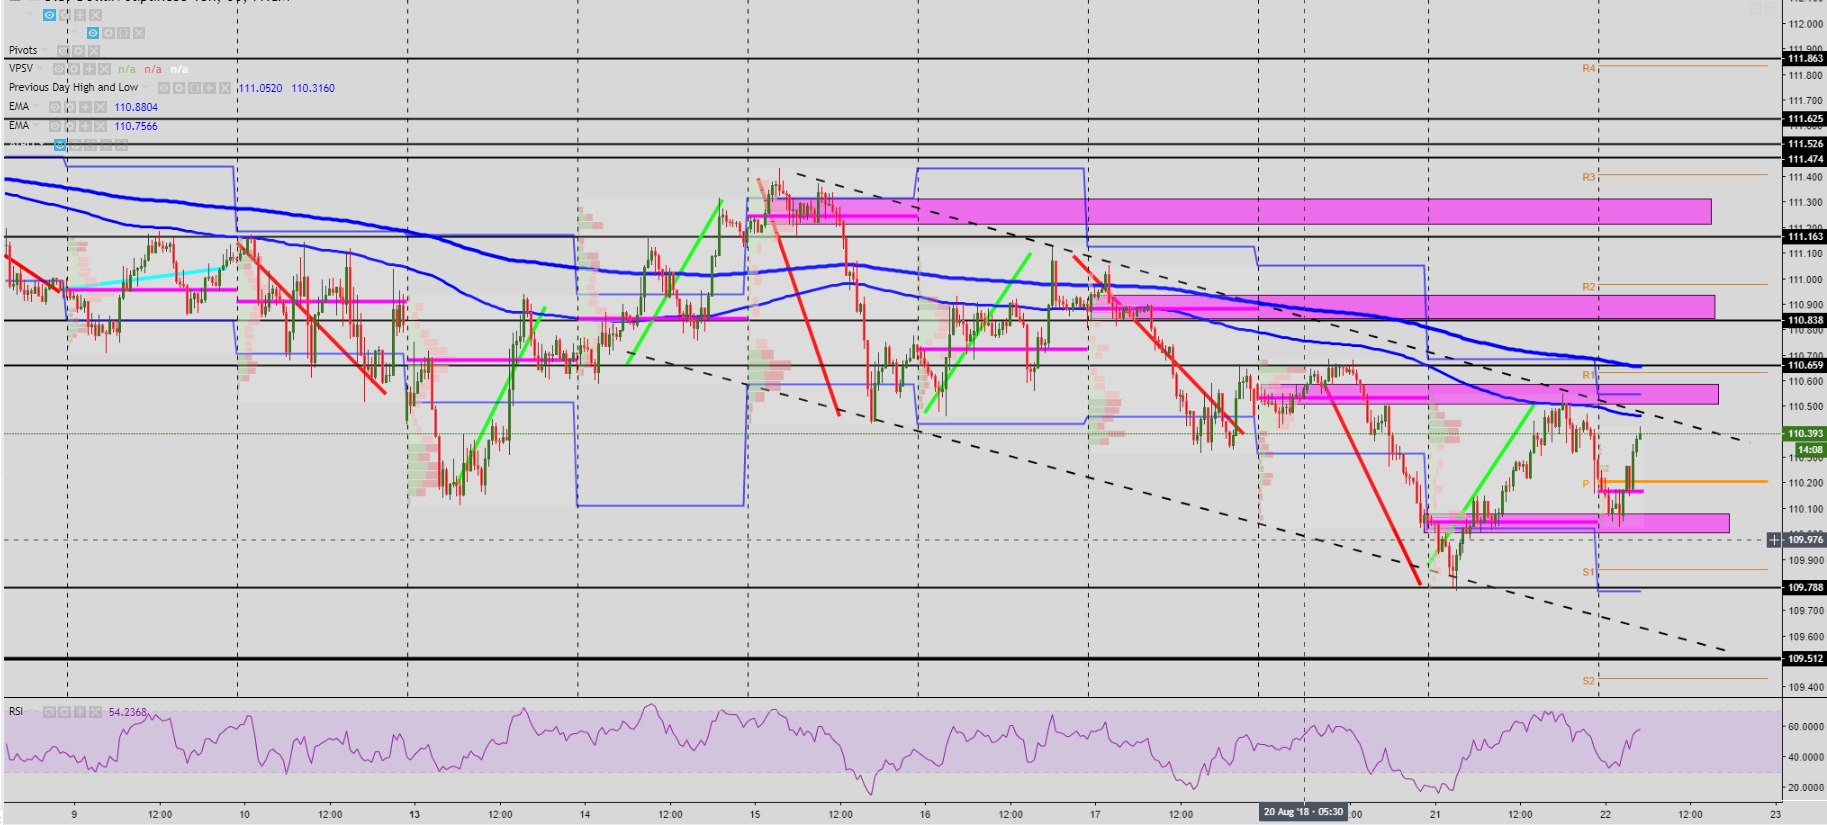
Intraday Technicals (30m)
After failing to extend into new lows, combined with the printing of Tuesday’s PoC (Point of Control) below the closing price, it appears as though the market is setting up the stage for a potential short-term consolidation with a narrow range between the latest PoCs at 100.00 and 100.50 respectively, with a wider range expanded into 109.80 and 110.65. The bearish slope in both the 100 and 200-hourly MA, the establishment of a downward channel as denoted by the dash lines drawn in the chart and an undermined risk profile given the worsening US political scene on Cohen revelations should be factors posing increased risk towards an eventual resumption of the bearish trend. To the upside, a breakout will find Aug 17th PoC within close proximity ahead of 111.00 as another key resistance. On the downside, the area of critical support is seen at 109.50 (macro level) should 109.80 be broken.
AUD/USD: Tentative Signs of a Potential Top Nearing
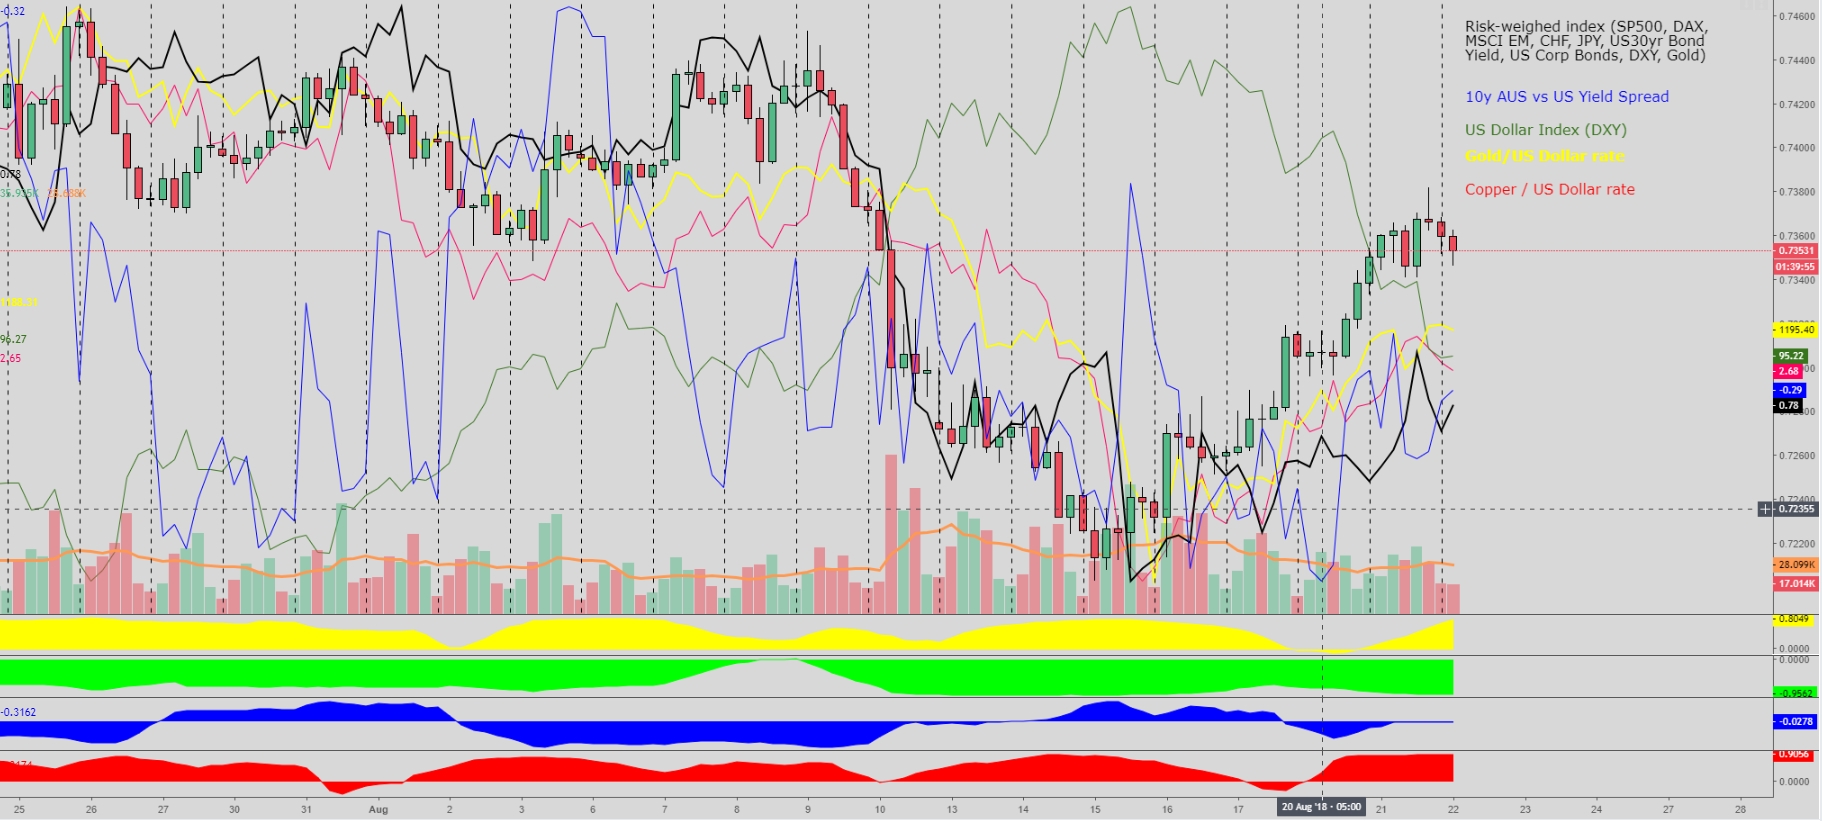
Volume, Price Action, Correlations, Fundamentals (H4)
The rise in the Australian Dollar has seen a slight uptick in total volumes, although gains were far from impressive in the last 24h in an environment meant to be conducive for a better performance. As long as the US Dollar remains pressured, the pair should remain supported, but risks are mounting as Australia faces political turmoil as Prime Minister Malcolm Turnbull could face a second leadership spill Reuters reports. We’ve also seen the printing of an inverted hammer which may be interpreted as a potential exhaustion given the rapid rise in the Aussie. Gold and other commodities such as copper have seen mild gains, while the Australian vs US 10-yr bond yields spread was largely unchanged.
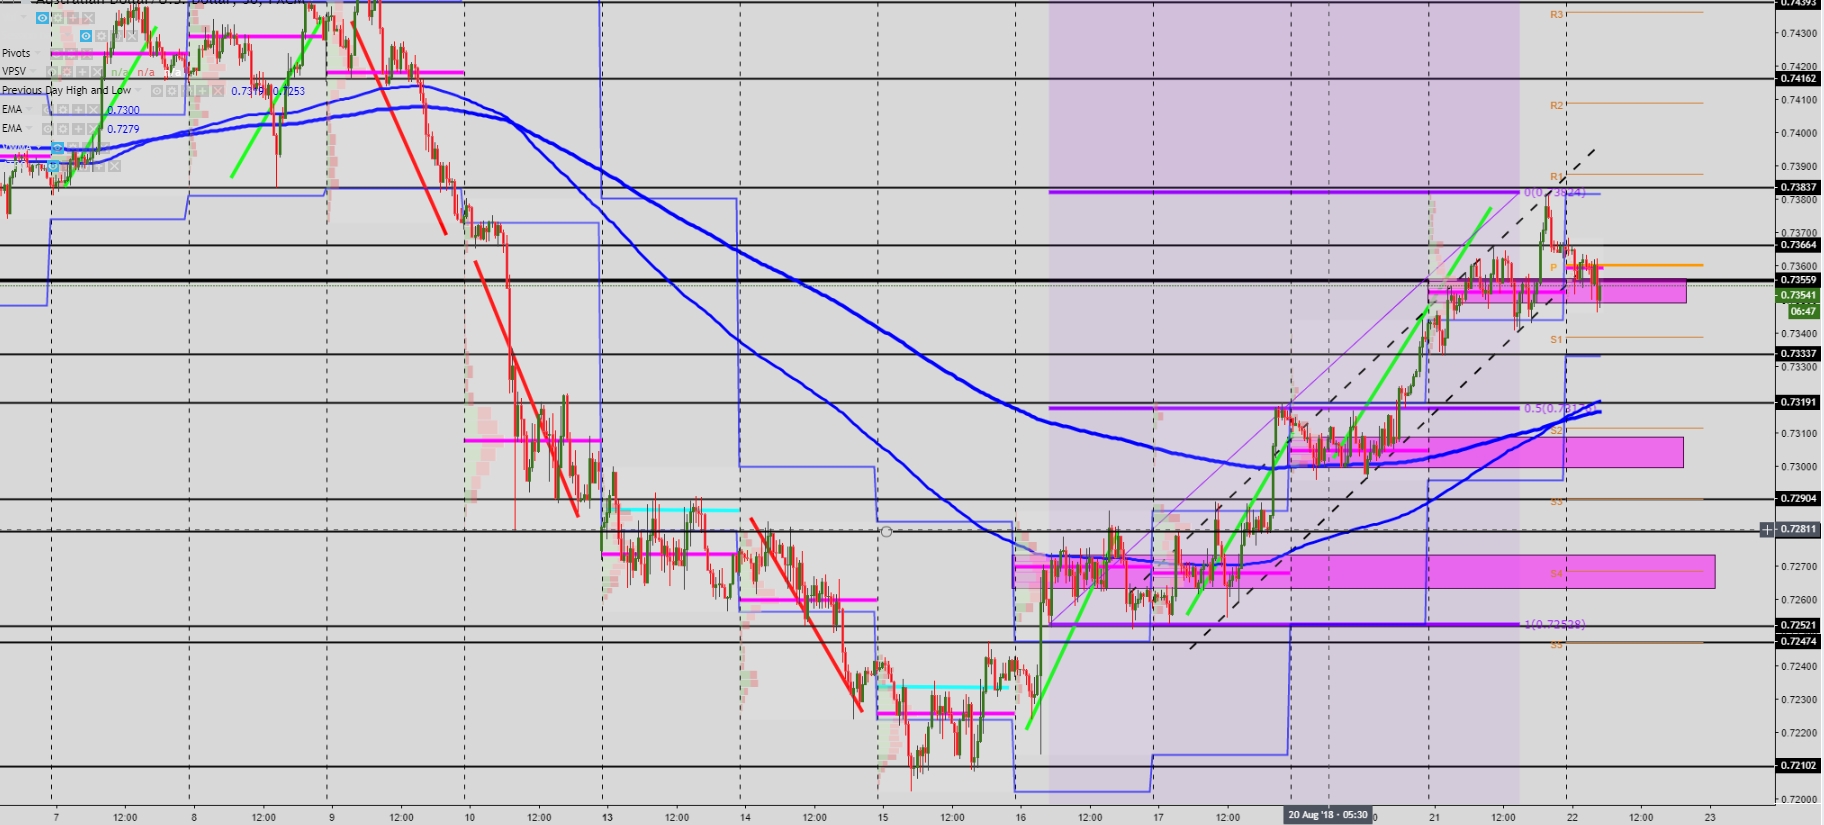
Intraday Technicals (30m)
The upward channel that has commanded prices higher this week has been broken, while offers also managed to penetrate Aug 21st PoC (Point of Control), both event signaling the formation of a potential top being in place, which is reinforced by the bullish extension having reached a 100% fib proj target to the pip, as depicted by the purple line. A follow-through sell-side wave is expected to meet a series of intraday swing lows acting as support lines at 0.7343, ahead of 0.7333 and of 0.7320, the latter being the most relevant nearby support, as it intersects with the 100 and 200-hourly MA. The current bullish structure in the 30m chart, which is starting to see cracks given the break of the upward channel, will be fully negated if the most recent swing low at 0.7343 is broken. On the flip side, should buyers regain the upper hand, expect intraday resistance at 0.7366 ahead of 0.7383 and 0.74 round number.
“Past performance is not a reliable indicator of future performance“