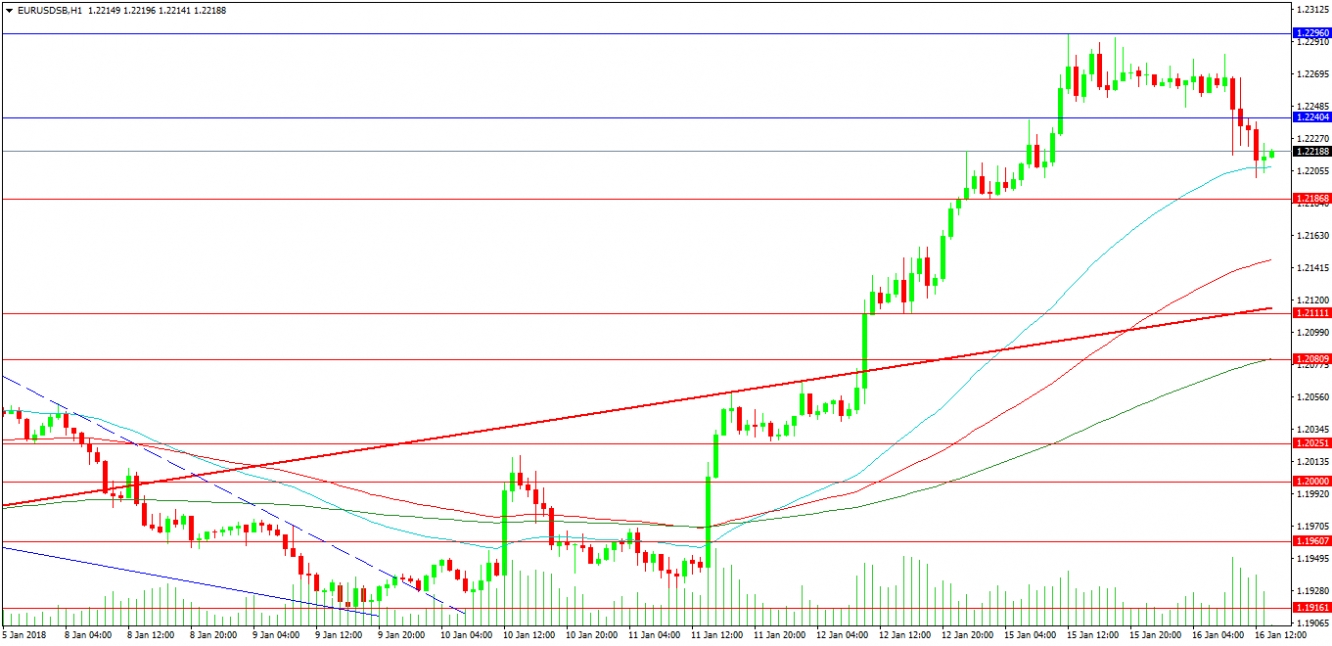
The Euro had gotten to a high of 1.22960 against the USD yesterday, before retracing to test support at 1.22000 this morning. The rally higher over the last few days took place despite the fact that trend line support was lost on the 8th of January. The pair spent the next three trading sessions below this red trend line, before retesting it and then breaking higher at 1.20733 on the 12th. This is a classic case of previous support becoming resistance, but on this occasion that resistance was broken. A retest of the trend cannot be ruled out while the price stays below 1.23000, and with that in mind, the current price of the trend line is 1.21134. Close support can be found at 1.21868 and the price is currently tackling the 50-Hour MA above it.
The 100-hour is at 1.21453 and the 200-hour is at 1.20809, either side of the red support trend line. A loss of these supports targets the round number of 1.20000. German political issues are again taking centre stage today, with reports suggesting there is some opposition within the SPD towards forming a coalition government with Merkel’s CDU. Whether this is posturing or something more meaningful remains to be seen but EUR/USD had slipped as a result.
Italian FTSE MIB
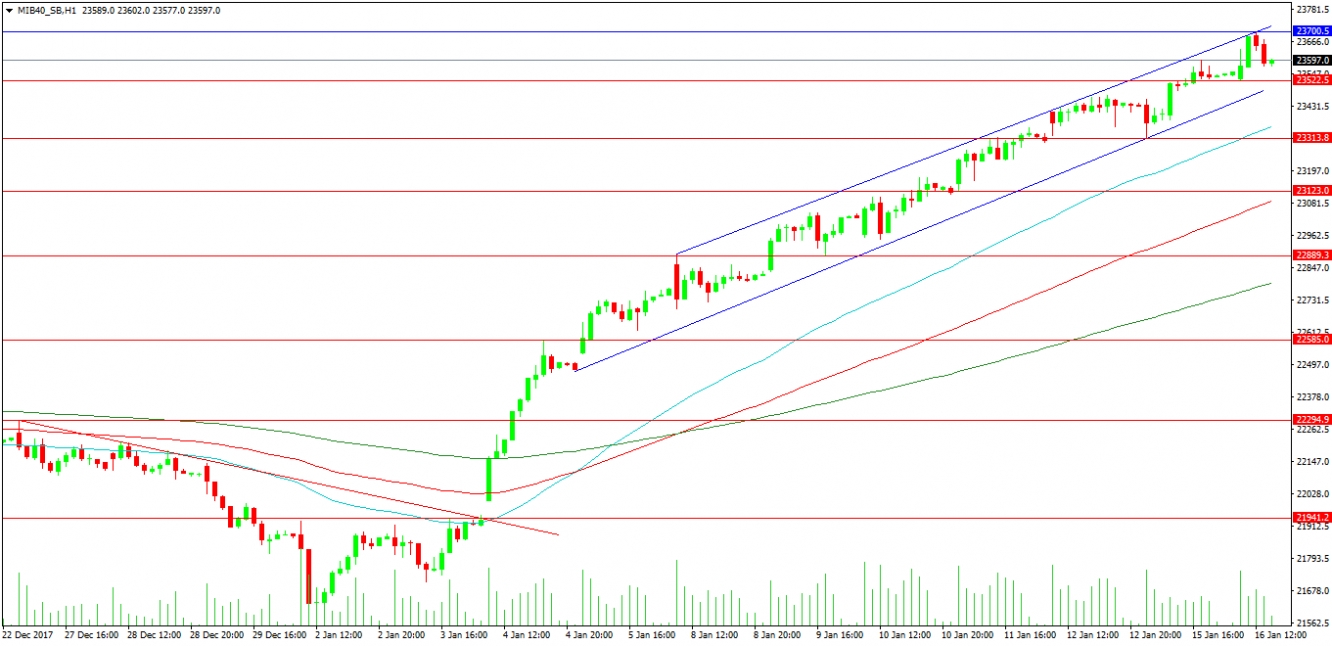
This Index has been on a strong bullish leg higher since the 2nd of January, gaining some 2000 pips in that time. Current highs achieved today at 23700 are located at the top of the bullish channel that price entered on the 8th of January. In essence, unless traders sell the index below the channel bottom, the price should remain supported and bullish. This rally was triggered by a break of resistance late on the 3rd when a trend line, the 50-Hour MA and the 21941.0 resistance level were broken. The market opened the following day with a breakaway gap higher and never looked back. That first hour of trading on the 4th took price through the 100-Hour MA and right up to the 200-Hour MA. In the 1-Hour chart, none of these MAs have been retested, telling the story of a strong Bull Market.
The 50-Hour MA is currently below the 23522.5 support level and is located at 23357.0. The 100-Hour is below the 23123.0 support level and is located at 23086.6. Round number support is at 23000.0 with further support at 23889.3 and the 200-Hour at 22791.3. Some 1000 pips below current price action, and close to the 50% Fibonacci retracement level of the 2018 trading range, is support at 22585.0, the 4th of January daily high.


