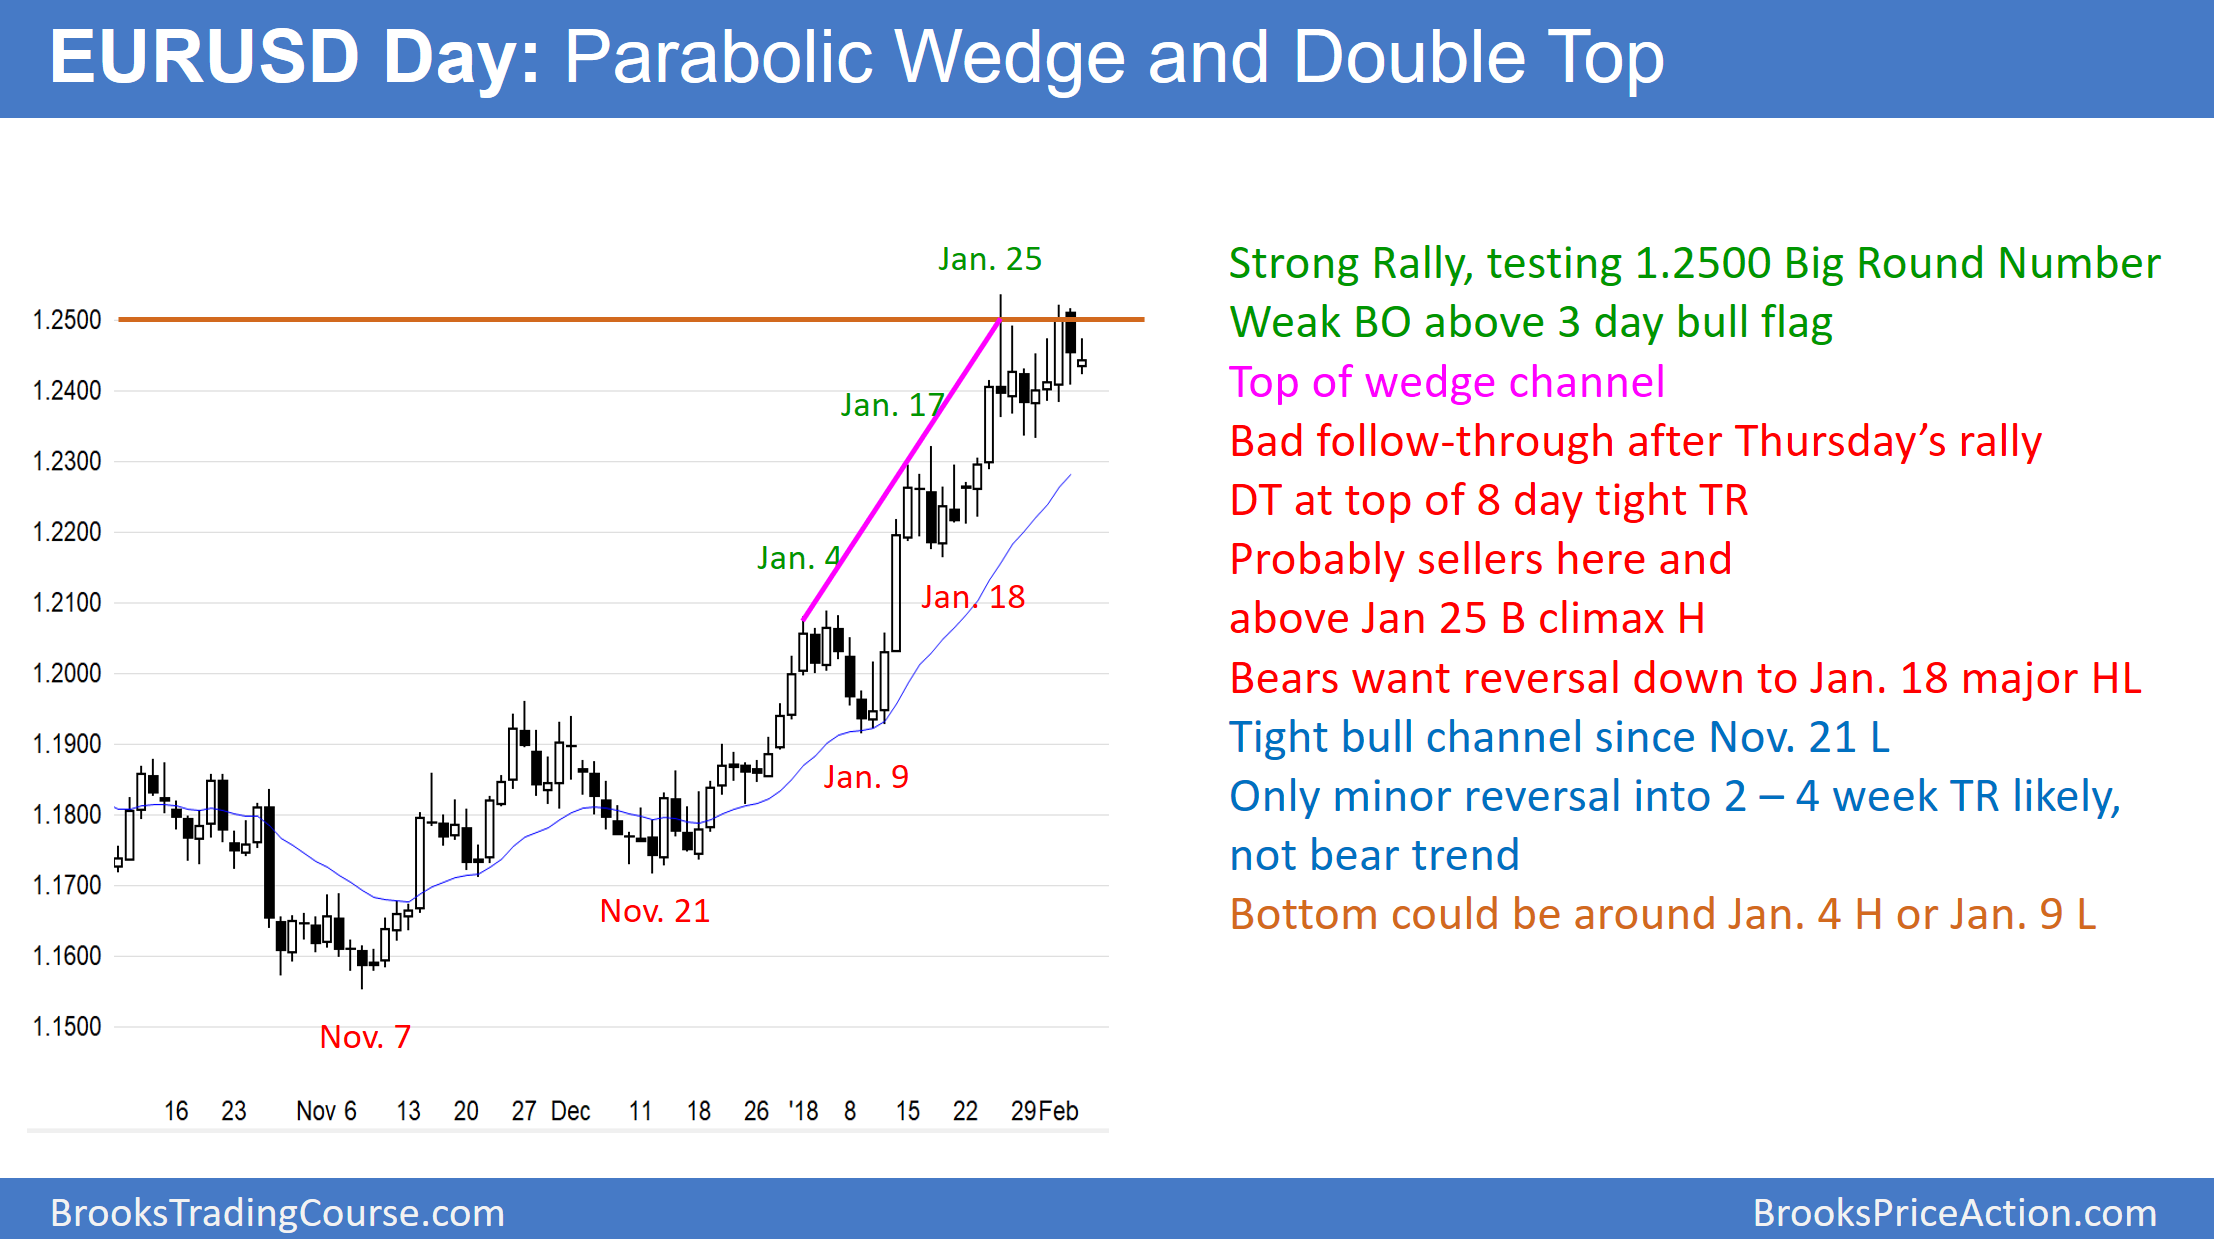
The EUR/USD daily Forex chart has been in a tight trading range for 8 days. Since it is at the resistance of the 1.2500 Big Round Number and it is in a parabolic wedge top, the odds favor a pullback for a few weeks. There is now an 8-day double top.
While the EUR/USD daily Forex top has continued to break above resistance for a year, the odds are that it will pull back over the next few weeks. The rally is staring to collect many bars with tails on top, and it is in a parabolic wedge channel. These are signs that there are not enough bulls here. Consequently, the chart will probably have to trade lower to find eager buyers. If there is a reversal over the next few days, it will probably have at least 2 legs down and last 10 or more bars. That is what typically happens if there is a reversal from a buy climax.
The bulls want any pullback to be brief and shallow. The want another leg up to start this week because they want the strong 3 month bull trend to continue. Yet, it is more likely that the trend will convert into a trading range that will probably last at least another 2 weeks. The bulls need consecutive strong bull bars breaking above the high of 2 weeks ago before traders will conclude that the bull trend is resuming without a pullback. More likely, there will be sellers at a new high and the breakout will reverse after only a few days.
Overnight EUR/USD
The EUR/USD 5-minute Forex chart is at the top of an 8-day trading range. It has rallied for 4 days but the rally has had deep pullbacks. Therefore, it is more likely a bull leg in the range instead of a resumption of the bull trend.
Since is has been in a 40-pip range overnight, day traders are scalping. They will continue to do so until there is a strong breakout up or down. Furthermore, because of the pattern on the daily chart, if there is a strong bull breakout, day traders will look for a reversal down.

