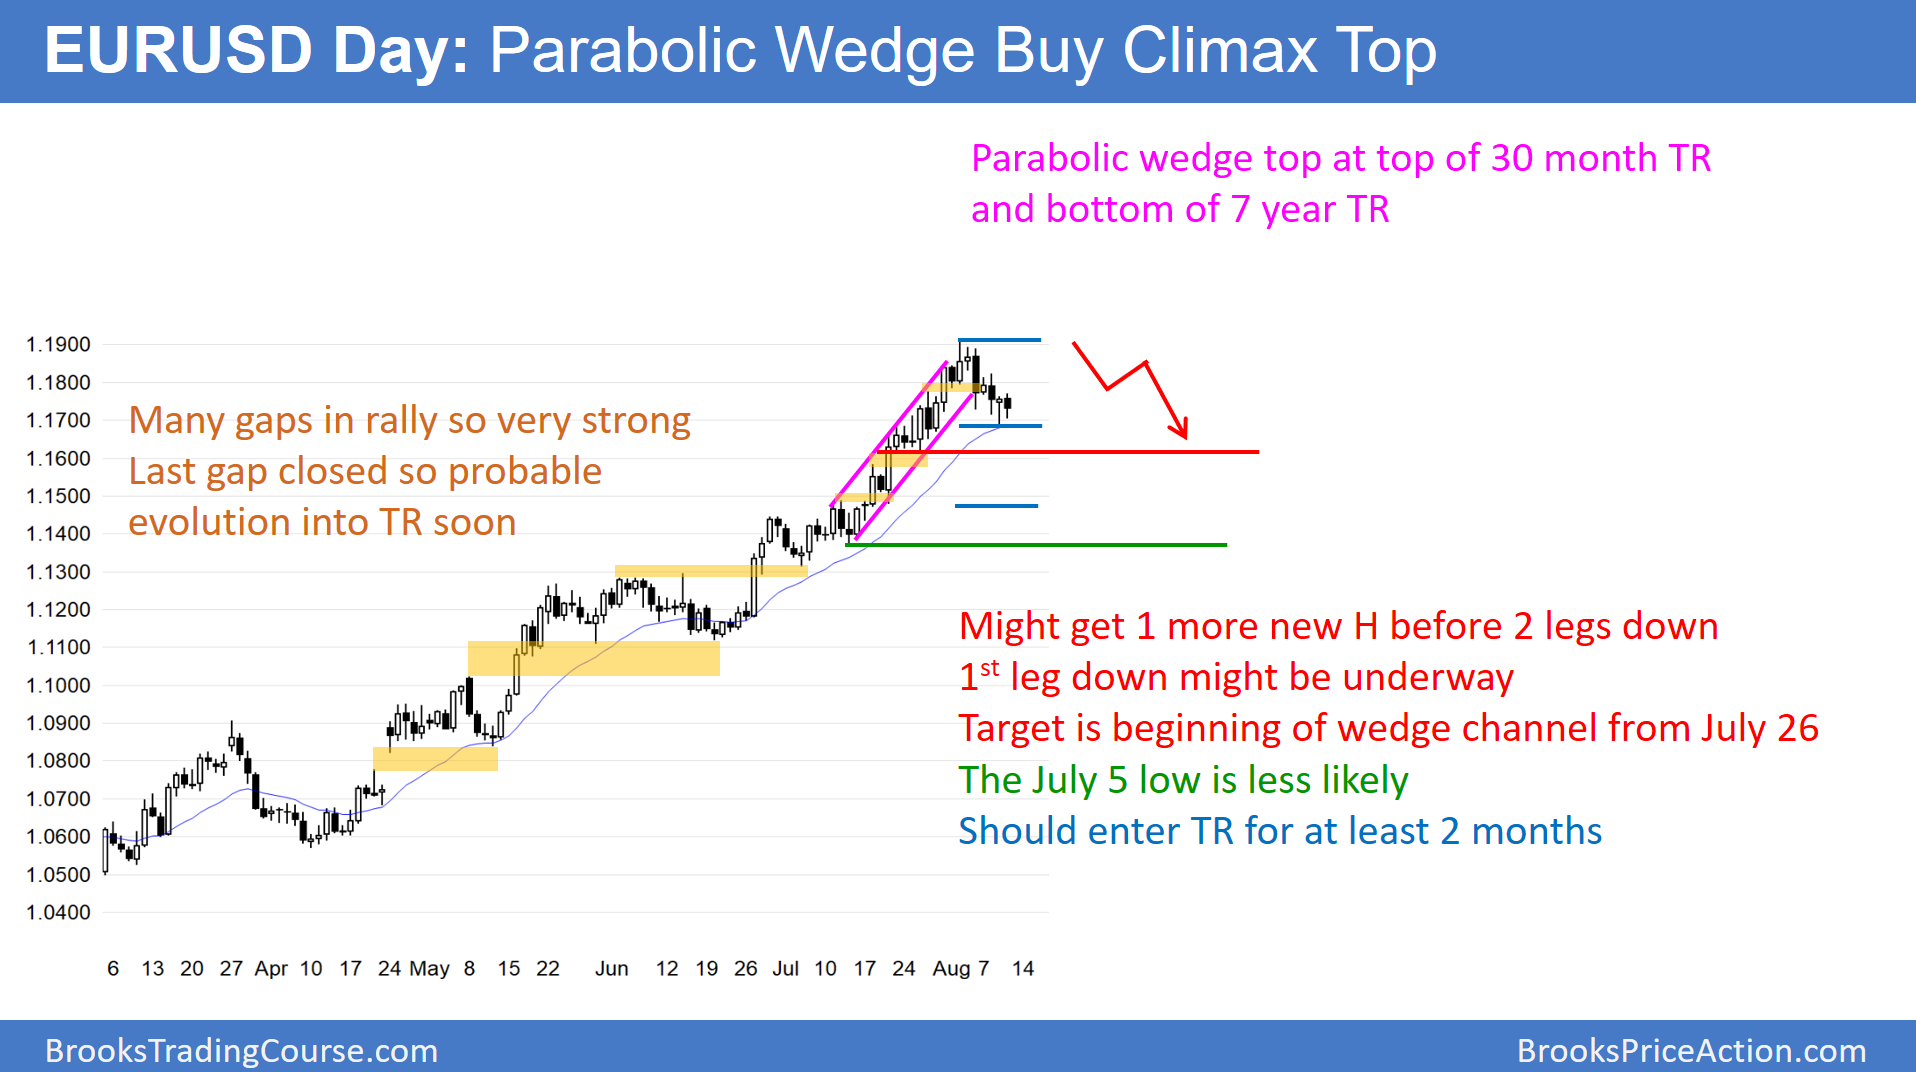
The daily chart of the EUR/USD Forex market pulled back to the moving average in a wedge bull flag. Since the 5 month rally is climactic, the odds favor a 2 legged, 300 pip correction down to the July 26 low. There might be 1 more new high 1st.
The daily chart of the EUR/USD Forex market has pulled back in a wedge bull flag for the past 8 days. Since this is the 1st test of the 20 day exponential moving average in more than 20 days, bulls will buy here. Yet, this bull flag is following a buy climax at resistance. Therefore, this pullback to the average price might be the start of a correction down to the July 26 start of the most recent bull channel.
Nested channel
The channel from April is nested. There was a breakout on July 20 and a 2nd channel began on July 26. Its low is 300 pips down from the high. That is a likely target for a correction. The bulls will probably buy there. Hence, the daily chart would therefore bounce and enter a trading range for at least 2 months.
The bulls need the monthly chart to break back into the 10 year trading range above 1.2000. If they fail over the next few months, then the odds favor a 600 pip correction down to the July 5 low.
Overnight EUR/USD Forex trading
The 5 minute chart has bounced from around 1.1700 4 times over the past 5 days. The bulls want a breakout above the 8 day wedge bull flag. They then want the 8 month bull trend to resume. The bears want a trading range, whether or not there is one more new high 1st. Hence, day trading bulls are buying selloffs for swings and scalps. In addition, day trading bears are selling rallies for swings and scalp. Many of the legs over the past several weeks have been big enough for scalpers to go for 20 – 30 pips profit.
A wedge bull flag is a breakout pattern. While the odds of a bull breakout are slightly higher, the month long buy climax make a bear breakout almost as likely.

