Attention Shifts to U.S. Jobs
It’s been quite an action-packed first full week back after the new year and it’s not over just yet, with the widely followed U.S. jobs report still to come.
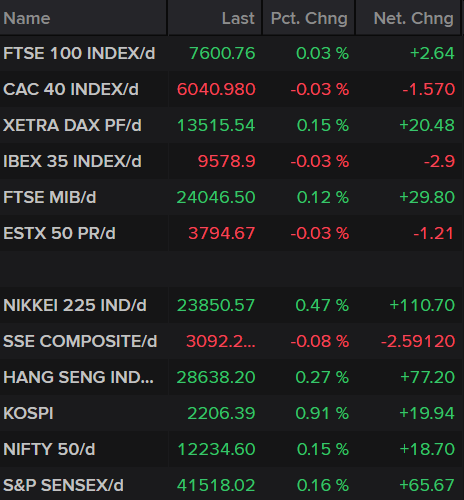
Tensions between the U.S. and Iran appear to have eased almost as quickly as they escalated, which has come as a massive relief to investors around the globe. The rotation into safe havens has basically unwound at this point but given recent events, they will be prone to repeat occurrences.
Reports overnight suggest that a rogue Iranian missile may have brought down the Boeing (NYSE:BA) airliner that killed 176 people. While this has sent shock waves around the globe, investors clearly don’t believe it risks re-escalating the conflict. Perhaps it serves as an unwanted reminder of the unintended consequences of these pointless conflicts. A sad day for all.
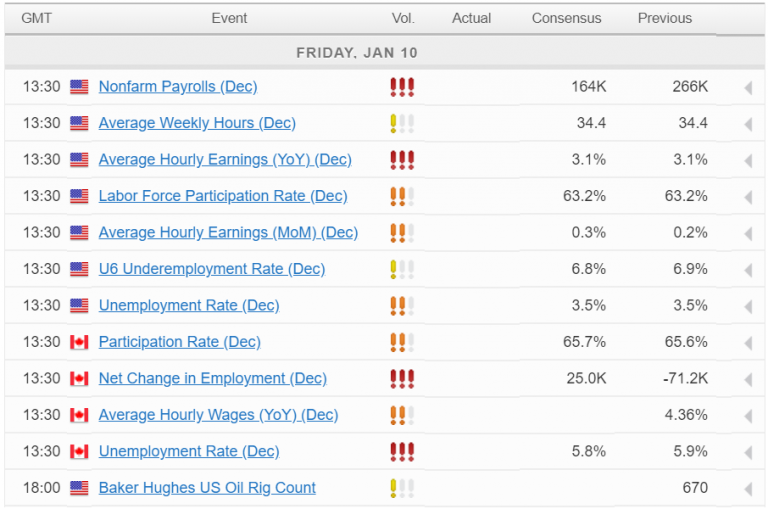
After such a bizarre start to the year, it’s easy to forget about the US jobs report today. Typically this has a massive red circle around it in the economic calendar but it’s understandably not attracting the attention it would usually receive. This may also have a lot to do with the fact that the Fed is expected to spend much of the year on hold.
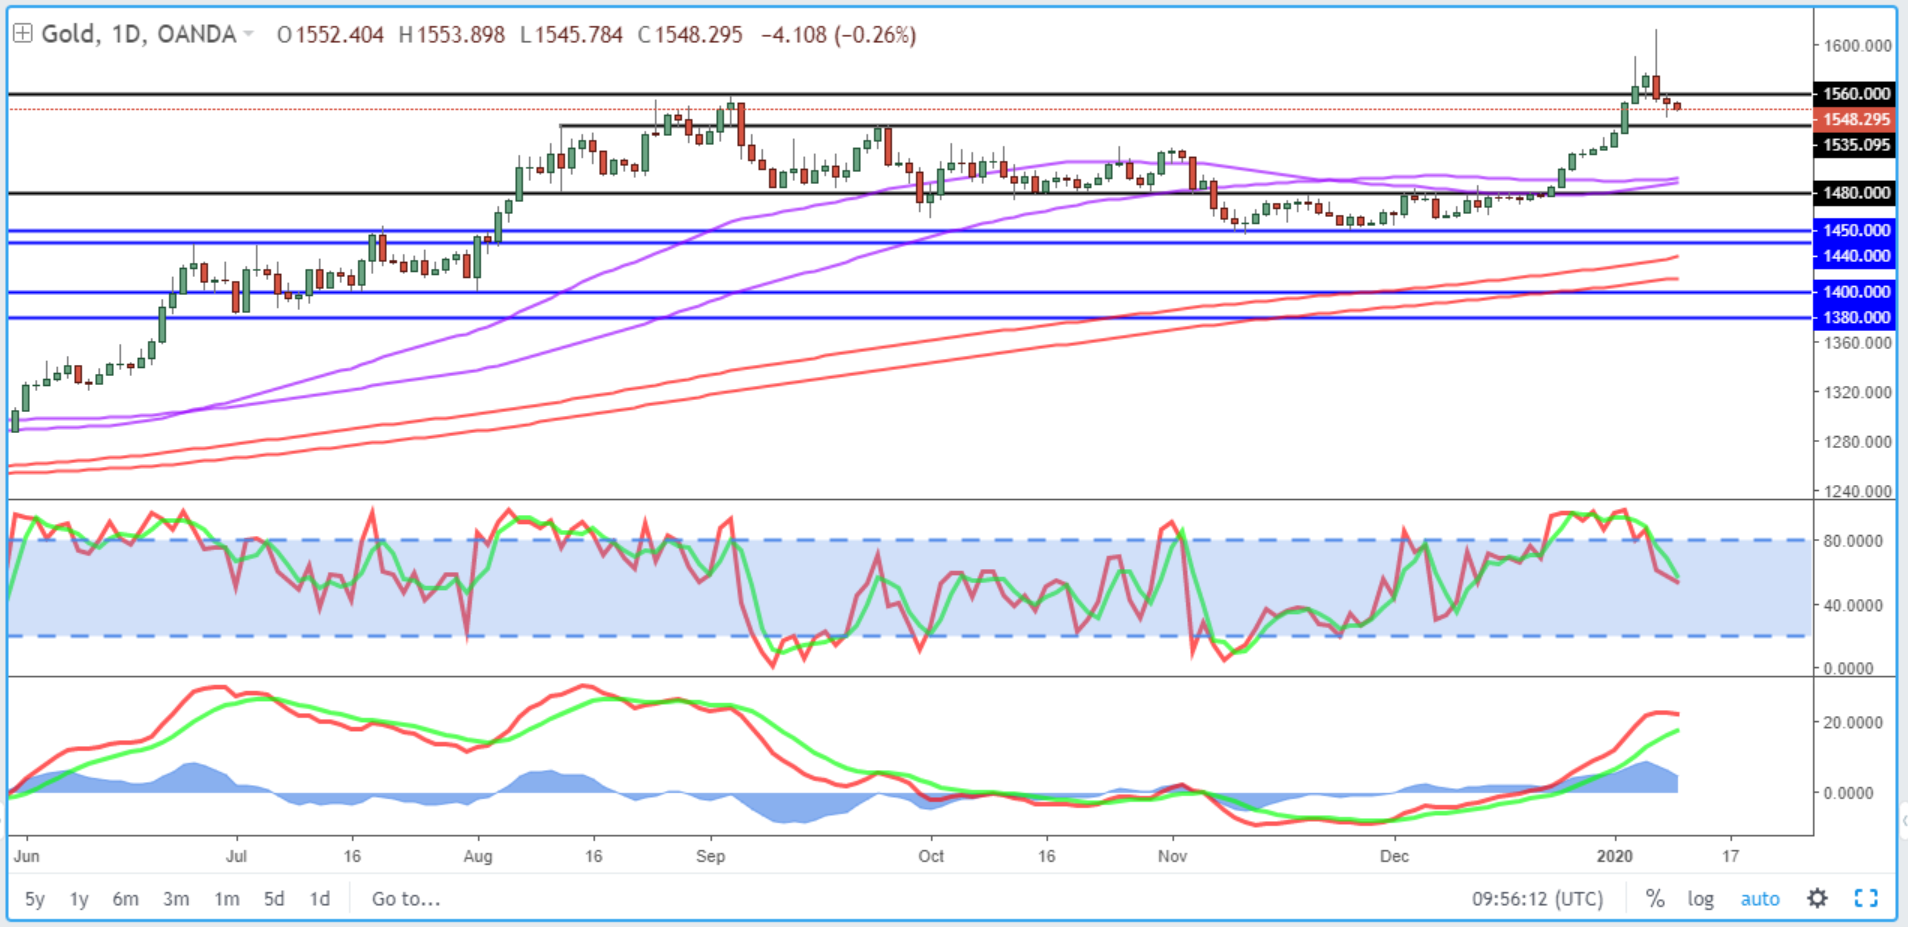
Gold settles around $1,550
Safe haven gold has found some stability towards the back end of the week around $1,550, not far from the levels we were trading at around at the start of the year. Gold will remain susceptible to safe haven dashes, although the tragic airliner accident may force people to reconsider their actions and encourage a sustained de-escalation.
The dollar has rebounded over the course of this week which may keep the downward pressure on the yellow metal although it’s worth remembering that prior to the events of the last week, the dollar was coming under a little pressure and supporting gold. It will be interesting to see whether that continues going forward.
Gold Daily Chart
Oil stable after wild week
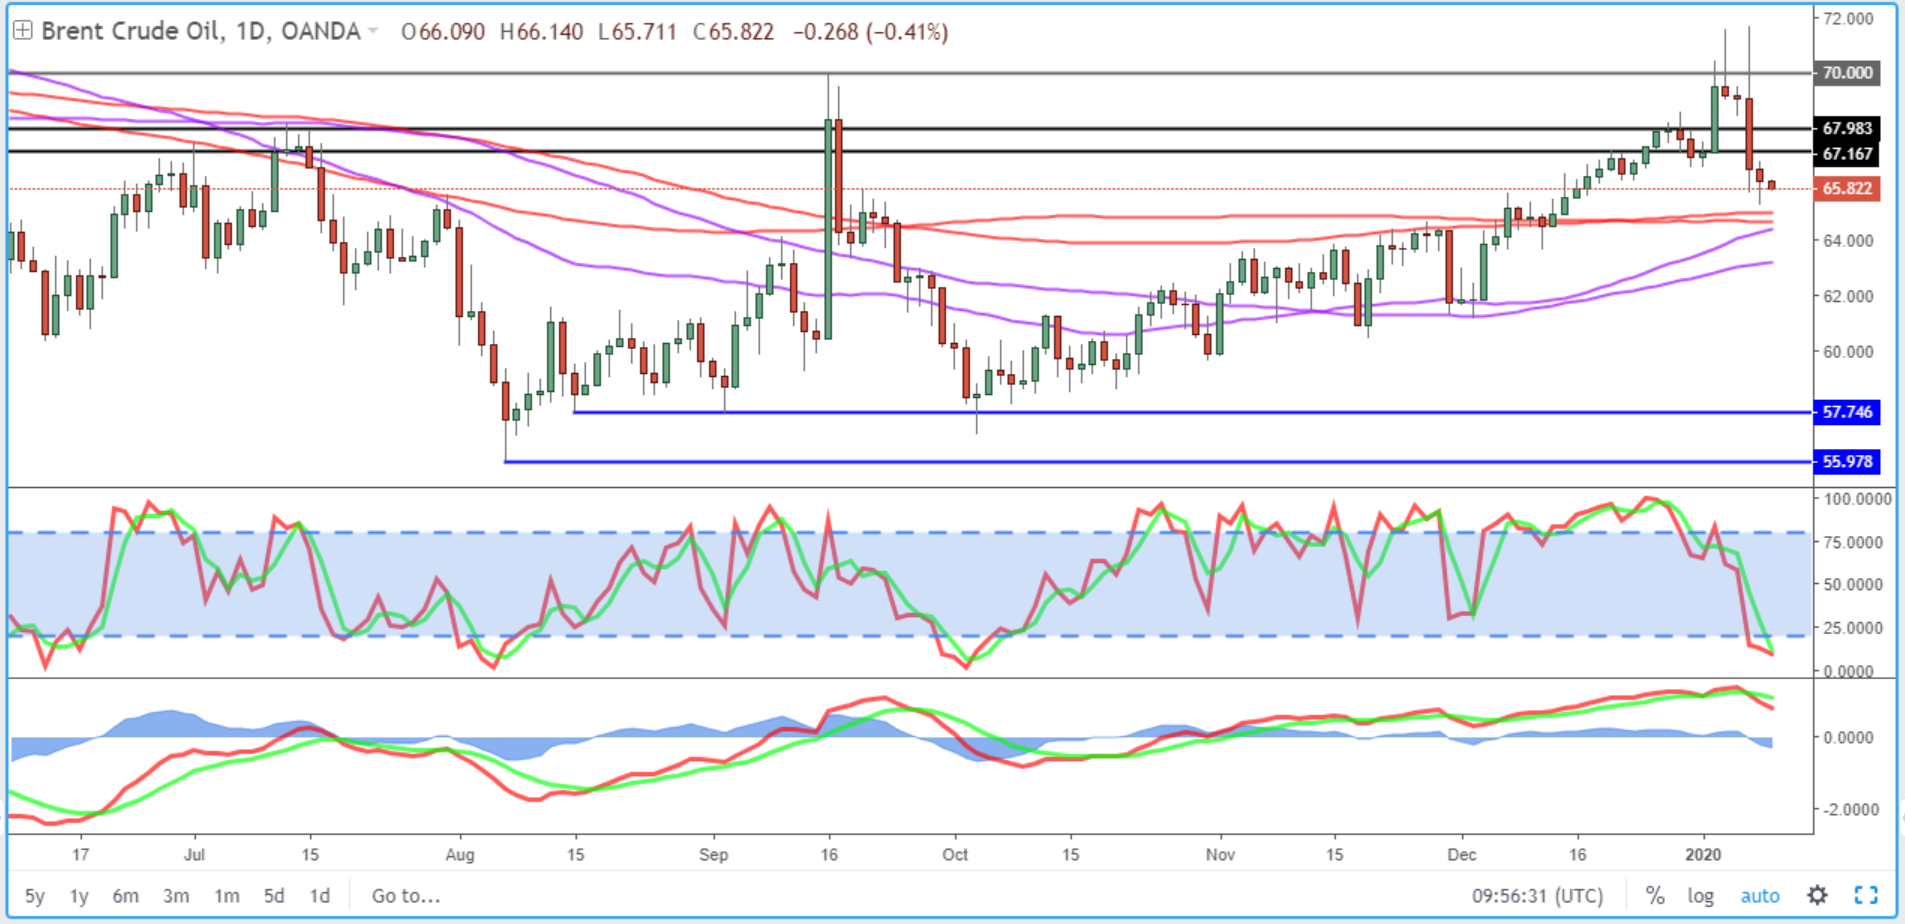
Oil prices have more that reversed the spike in prices that came in the aftermath of the Soleimani assassination. Brent is trading back around $65 and is looking pretty stable at this point. Barring any further escalation in the middle east, we could see oil prices stabilize around these levels in the near-term, with global growth prospects having improved, the U.S. and China preparing to sign a trade deal and OPEC+ committed to re-balancing.
Brent Daily Chart
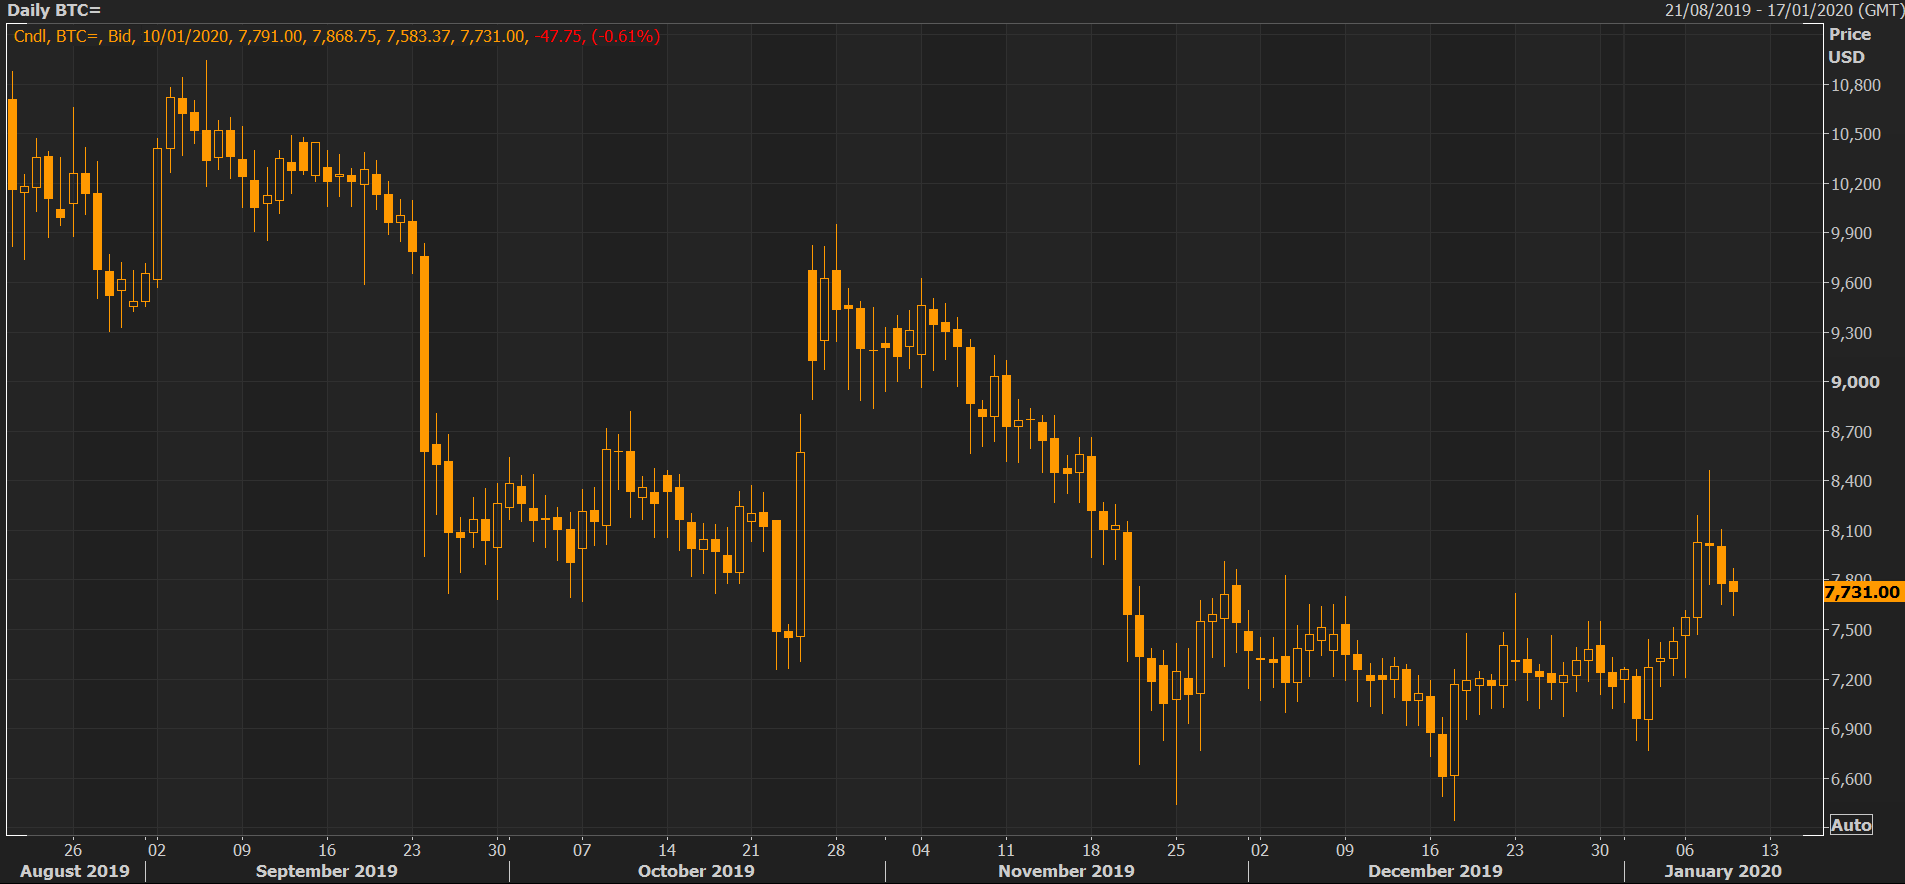
Bitcoin faces test around $7,500
Like a slow puncture, the bitcoin rally is slowly deflating but there’s clearly some resilience there. The cryptocurrency faces a test around $7,500 which provided strong resistance throughout the latter part of December. A hold around here could put further pressure on $8,500 where bitcoin ran out of steam earlier this week.
Bitcoin Daily Chart
Economic Calendar
