
- All Instrument Types
- Indices
- Equities
- ETFs
- Funds
- Commodities
- Currencies
- Crypto
- Bonds
- Certificates
Please try another search

European FX In Recovery Mode After Rosy EZ PMIs

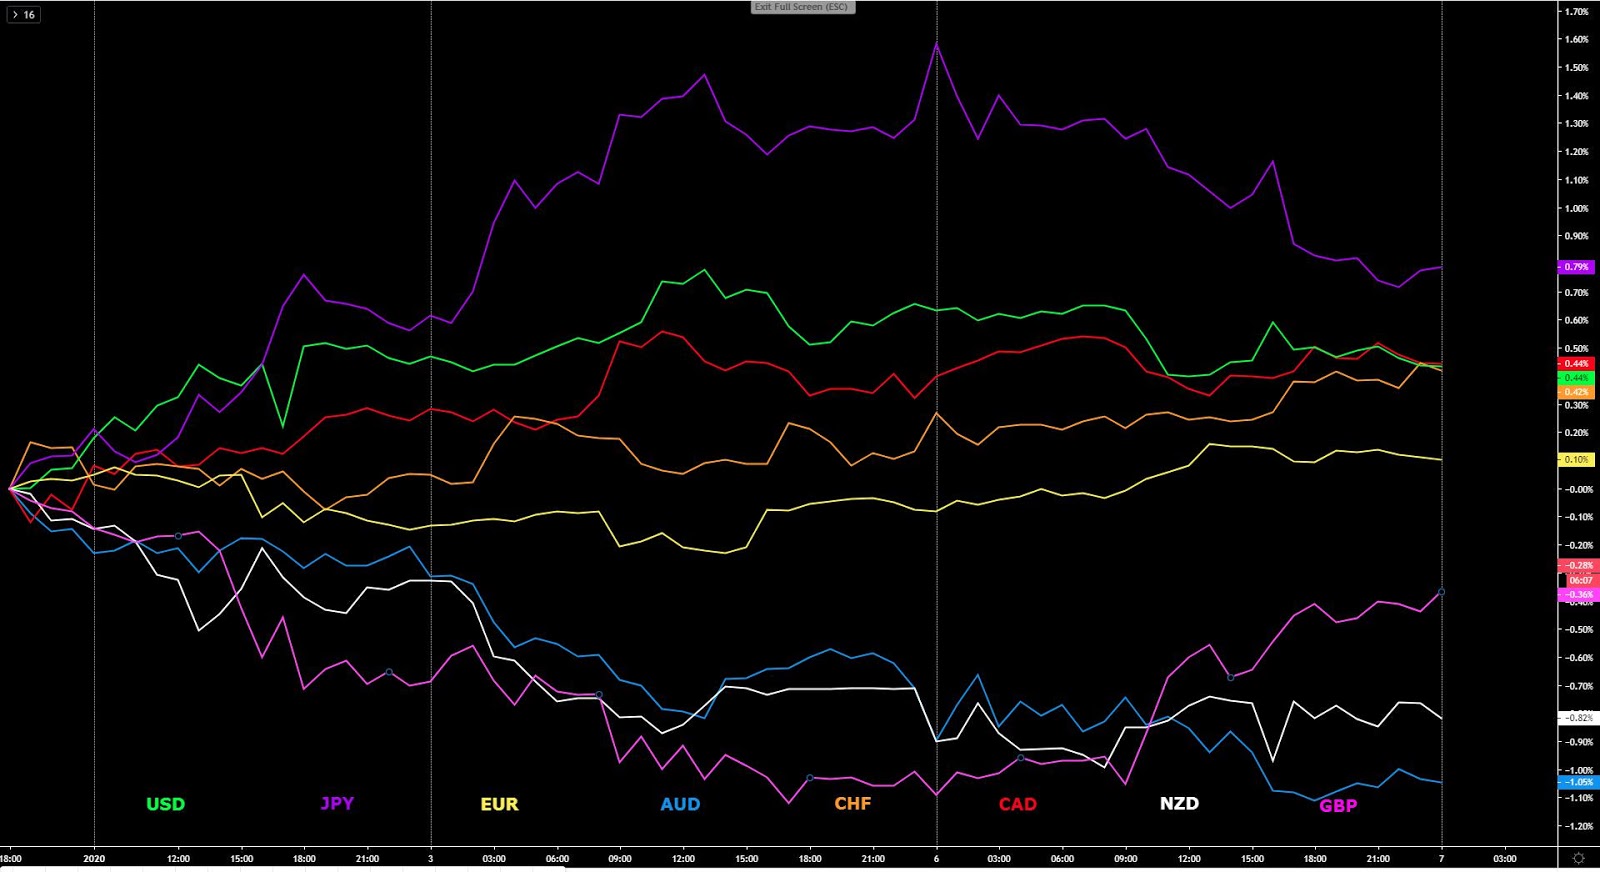
The euro, pound and to a lesser extent the Swiss franc attracted the most buying flows as the EZ/UK PMIs showed significant upward revisions. The yen, by far the outlier in terms of performance in the first week of 2020, failed miserably to sustain its gains. Will the Iran-US crisis override improving global PMIs as a driver? What currencies look best positioned structurally wise? Find out in today's report.
Quick Take
The thematic in the forex arena has swiftly transitioned from the US-Iranian crisis, which had led to an injection of risk off flows, to a more benign landscape, dominated by a sense that the global stabilization thesis into 2020 is still panning out.
The European block (EUR, GBP, CHF) led the charge higher after ‘across the board’ improvements in EZ/UK services PMIs, with further backing by the notable jump in German retail sales and the EZ sentix investor confidence. The recovery in risk appetite trumped the upward trajectory of the yen, by far the worst-performing currency as the week gets underway. The Aussie is not showing signs of life so far after the China services PMIs from Caixin / Markit came at a disappointing, but most importantly, the market pricing for a February rate cut by the RBA has gone up marginally as the ramifications of the bush fires for the overall economic activity in the country play out.
The Kiwi was largely unchanged for the day, with no drivers to take note of. The USD traded on the weak side despite still being one of the best performers this year, while the CAD built up on recent gains against the weakest currencies out there such as the yen, Aussie or Kiwi.
Narratives In Financial Markets
* The Information is gathered after scanning top publications including the FT, WSJ, Reuters, Bloomberg, ForexLive, Institutional Bank Research reports.
Iran-led risk-off fades: The overarching theme since last Friday has been an escalation in the US-Iran geopolitical tensions after the killing of the highest profile Iraqui military leader. This development resulted in the establishment of risk averse dynamics, although as I noted yesterday, the risks were clearly on the rise for the risk-off to fade out as the prospects of any type of full-blown war or an in-land invasion into the country was unrealistic. The positive performance in US equities and bond yields on Monday cements this view, with the market communicating that the Iran situation is likely to be a short-term side show before the market refocuses on new drivers. Any headlines that Iran has retaliated via temporary rattlings and/or minor attacks may still create volatility but hard to see this thematic sustainable.
EUR boosted on fundamentals backup: The Euro was emboldened by better Dec services PMI readings across the board. The figures printed out of Germany, the Eurozone, Italy and Spain played into the view that a tentative bottom may have been found in a sector negatively affected by the global trade war woes. The beat on estimates in Germany and Spain was particularly strong, with a positive deviation of 1 full point. While economic stagnation in these economies is still the name of the game, the evidence that no further deterioration is feeding through is an encouraging sign for now.
EZ fundamentals go full circle: The EUR found further buy-side interest as Germany’s November retail sales jumped to +2.1% vs +1.0% m/m expected (largest rise in 10 month). Consumption activity had a nice boost ahead of the holiday season. Besides, the Eurozone January Sentix investor confidence came at 7.6 vs 2.6 expected, representing more welcoming news. The dissipation of concerns in the US-China trade deal front and the temporary calmness in Brexit have definitely helped to take the reading to the highest since November 2018.
UK services PMI scratch expansionary line: The Pound was boosted piggybacking the rise in the Euro as the fundamentals in the UK also came out rather rosy, with the December final services PMI at 50.0 vs 49.0 prelim. The Composite PMI also rose to 49.3 vs 48.5 prelim. The conclusion here is akin to what’s been said about Europe above that is, the revision higher is a positive anecdotal evidence that the worst may be over, within the context of a lackluster activity in the services sector. The official statement read: "With manuf and construction output also subdued in December, the latest PMI surveys collectively signal an overall stagnation of the UK economy at the end of 2019.
US services PMI adds to case of global growth stabilization: The US Services PMI was also revised higher to 52.8 from 52.2, which is the icing on the cake in this idea that services PMIs around the globe are picking up in tandem. By breaking down the details, we observe that the US composite PMI also rose to 52.7 vs 52.2 preliminary, and even better, the services prices rose to 52.9 versus 50.3 in November. Highest since February 2019. The Non-manufacturing ISM later today will be another critical piece of fundamental information.
JP Morgan global PMI at 8-month high: The improvements in services PMIs across the European region this Monday reinforces the notion that the global stabilization thesis is playing out as we head into 2020. As a matter of fact, the J. P. Morgan Global PMI Composite Output Index rose to 8-month high at 51.7. Olya Borichevska, from Global Economic Research at J.P.Morgan, said: “The December global all-industry PMI came in positively at the end of the year reinforcing a view that activity will improve in the coming quarters. The all-industry activity PMI increased for the second month to an eight-month high. Improving trends in new order inflows, employment and business sentiment also suggest that further headway should be made at the start of the new year. International trade remains the main drag on efforts to lift growth further, so any moves that reduce tensions and barriers on this front will be especially beneficial.”
China services PMI the exception to the positive trends: The Aussie could not find sufficient buy-side interest after the China services PMIs from Caixin / Markit came at a disappointing 52.5 vs 53.2 expected. The data completes the Dec PMI series, which included China Dec PMI Manufacturing recovering slightly to 50.2 vs 50.1 exp and the China Caixin Manufacturing PMI which stood at 51.5 vs 51.6 expected.
Odds of an RBA rate cut increase: Another element that appears to be affecting the allure towards the Aussie is the bushfire crisis. The Australian PM Morrison has pledged $2bn over 2 years to rebuild the affected areas via a newly established National Bushfire Recovery Agency, with PM Morrison stating “the surplus is of no focus to me. What matters to me is the human cost and meeting whatever cost we need.” The market pricing for a February rate cut has gone up marginally, with a two-fold drivers, on the one hand, geopolitical tensions picking up, but also the ramifications of the bushfires for the overall economic activity in the country. The pricing for a rate cut is around 55% now.
US/China trade deal signing scheduled for Jan 15th: China is reportedly planning to send a trade delegation to the US on January 15 to wrap up the phase one trade deal signing, according to Bloomberg, citing people familiar with the matter. The report states that vice premier Liu He will head the delegation to seal the deal, with the dates scheduled to be in Washington from 13 January to 15 January. Market participants are still waiting to have access to the actual details of the deal to adjust valuations on the asset classes most impacted by the deal such as equities, the Aussie, the Chinese Yuan, bonds.
Insights Into FX Index Charts
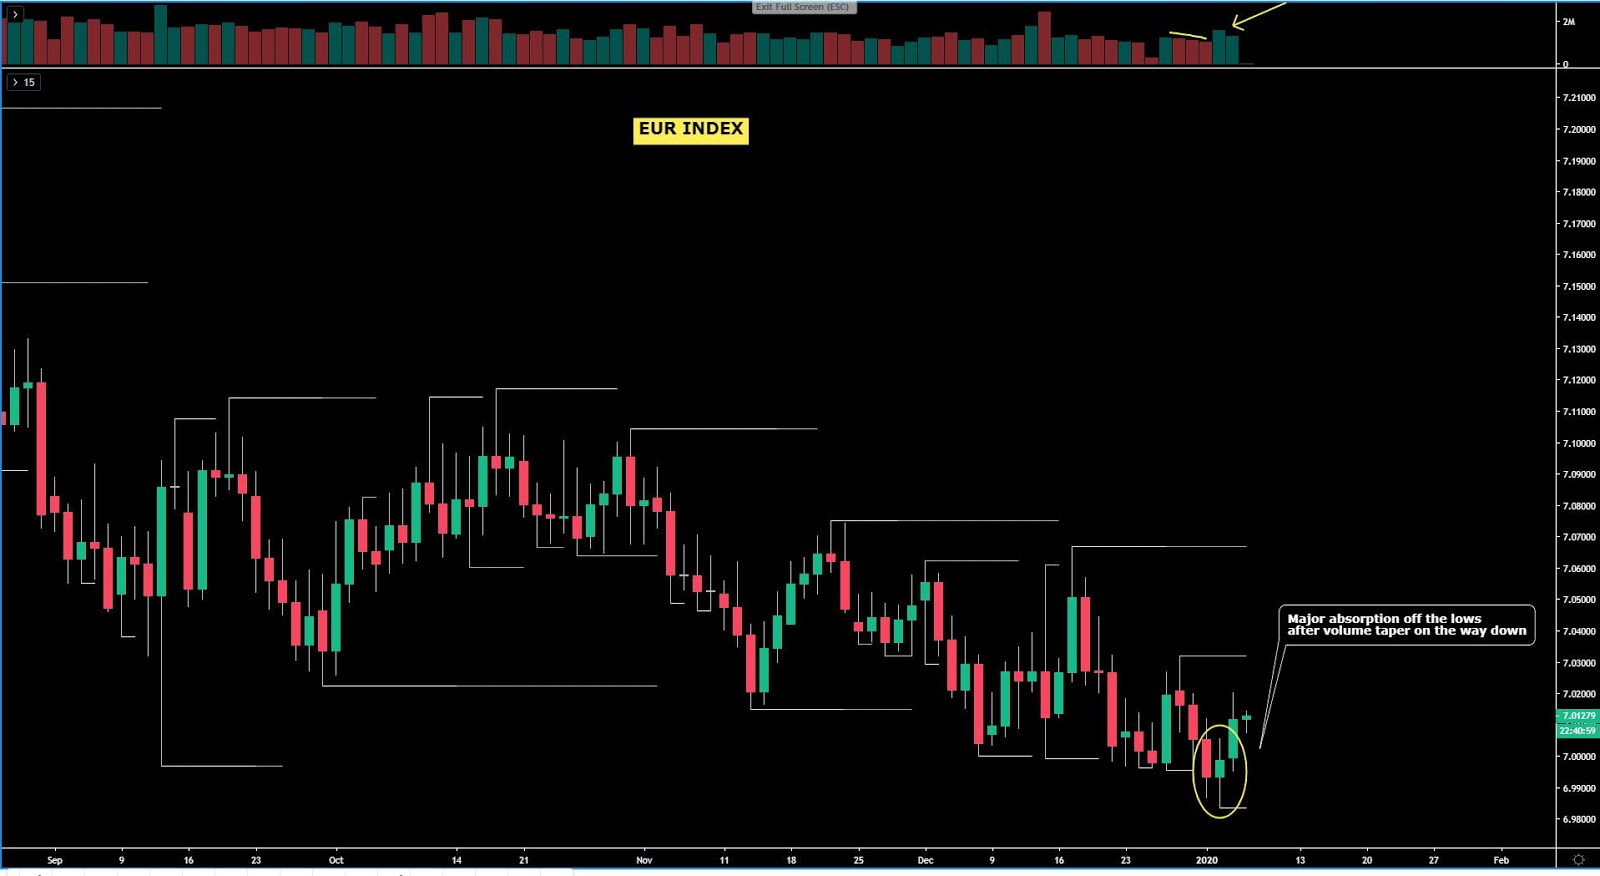
The EUR index was the top performing currency on Monday, as the market keeps pricing in more positive fundamental developments (Eurozone-wide services PMIs). The absorption candle last Friday was perfectly timed as a precursor for higher prices, a formation that was also supported by the daily aggregate tick volume structure. Whenever tick volume tapers on a successful rotation, the risk of a fade out is a scenario to always be on the lookout for. I wouldn’t be overly optimistic on follow through continuation at this stage due to the following reasons. 1. The market structure remains bearish. 2. The tick volume is decreasing. 3. Forex seasonals for the Euro in January tend to be very poor. If one is still interested in long-sided business, a retracement towards cheaper valuations would be a logical approach first.
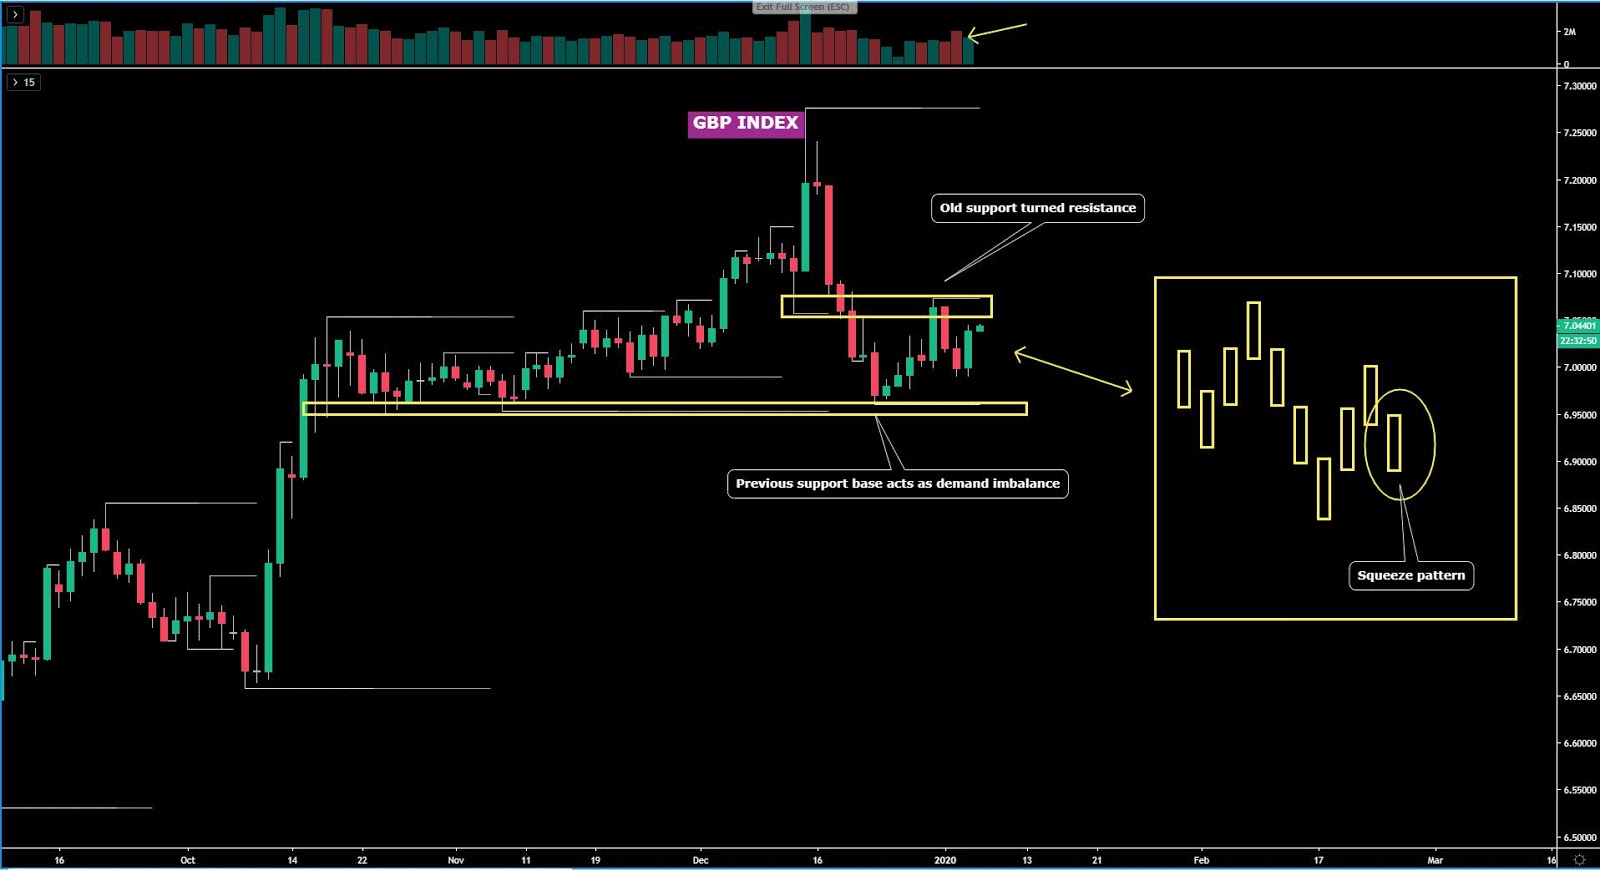
The GBP index, so far, is not respecting the squeeze pattern formed last Friday. The commanding bullish candle raises the prospects that we may end up seeing the recent highs taken out first before the bearish successful rotation thesis. The preponderance of evidence when playing this pattern over the year, one that I learnt via Bill Williams, is undeniable though. The current market structure in this currency index is bearish at this point, although that may be about to change if the Dec 31 high is re-taken and acceptance is found above. Therefore, more work needs to be done for the market to establish a clearer bias.
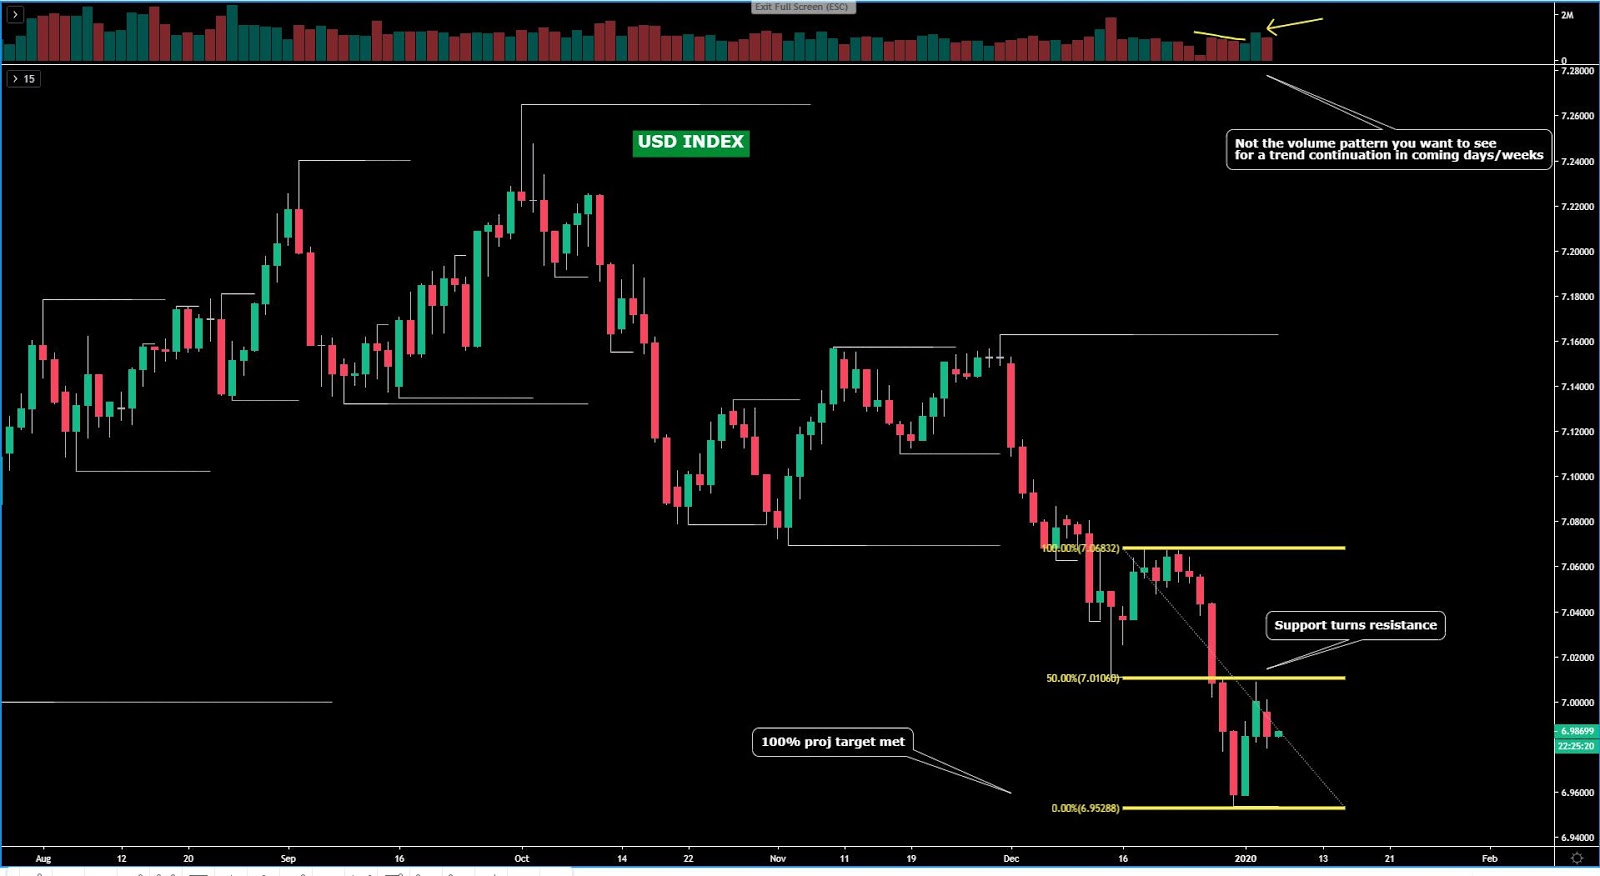
The USD index could be in the midst of a reversal from its protracted bearish tendencies. I am starting to observe technical evidence that such prognosys could be panning out in the days/weeks to come, even if it’s too premature. Firstly, after a number of successful bearish legs, the last one shows a lack of commitment by sell-side accounts based on the aggregate tick volume (volume tapering or false acceleration). Besides, the recovery displays the opposite pattern, with volume picking up last Friday, followed by low volume on a down candle on Monday. What’s more, the 100% proj target was respected to the pip, an area that tends to represent, at times, the termination of a market cycle. Seasonal patterns are also favoring the accumulation of USD long inventory this month (best performing month of the year). With that said, the index remains structurally bearish, but it is at these times, that picking the right shift in sentiment pays off most handsomely. I aim to be a USD long this month, and while we are nowhere near a full shift in the bearish structure, some initial evidence is emerging.
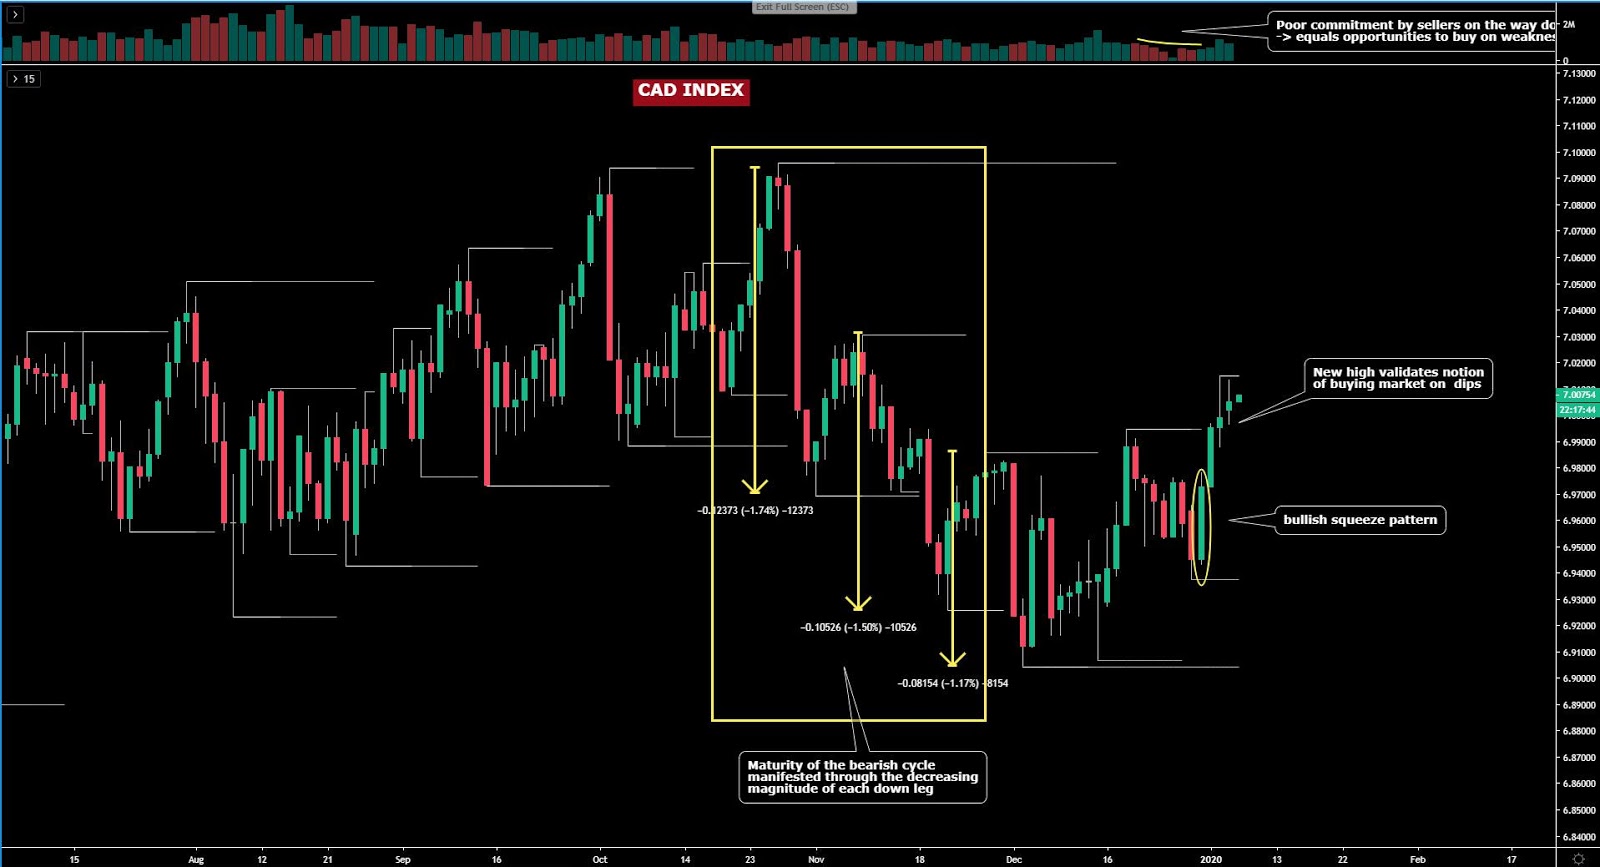
The CAD index, on the back of a well-telegraphed shift in market structure from bearish to bullish through late Q4, has found trend-trending account committed to keep pushing the currency into fresh lofty levels. Personally, unless you aim to scalp this market intraday, I don’t see any value in engaging in the accumulation of CAD long inventory at this stage. A bullish bias into January is my base case but allowing for a pullback is essential to lock in a better deal. The CAD, at an index levels, paints a storyline very much in congruence with my bullish view on the currency, predicated on the fact that the BOC is one of the outlier Central Banks still paying a relatively much higher interest rate than the rest of the G8 FX space. The seasonals for the CAD are also positive, averaging over 0.33% of gains in Jan for the past 36 years.
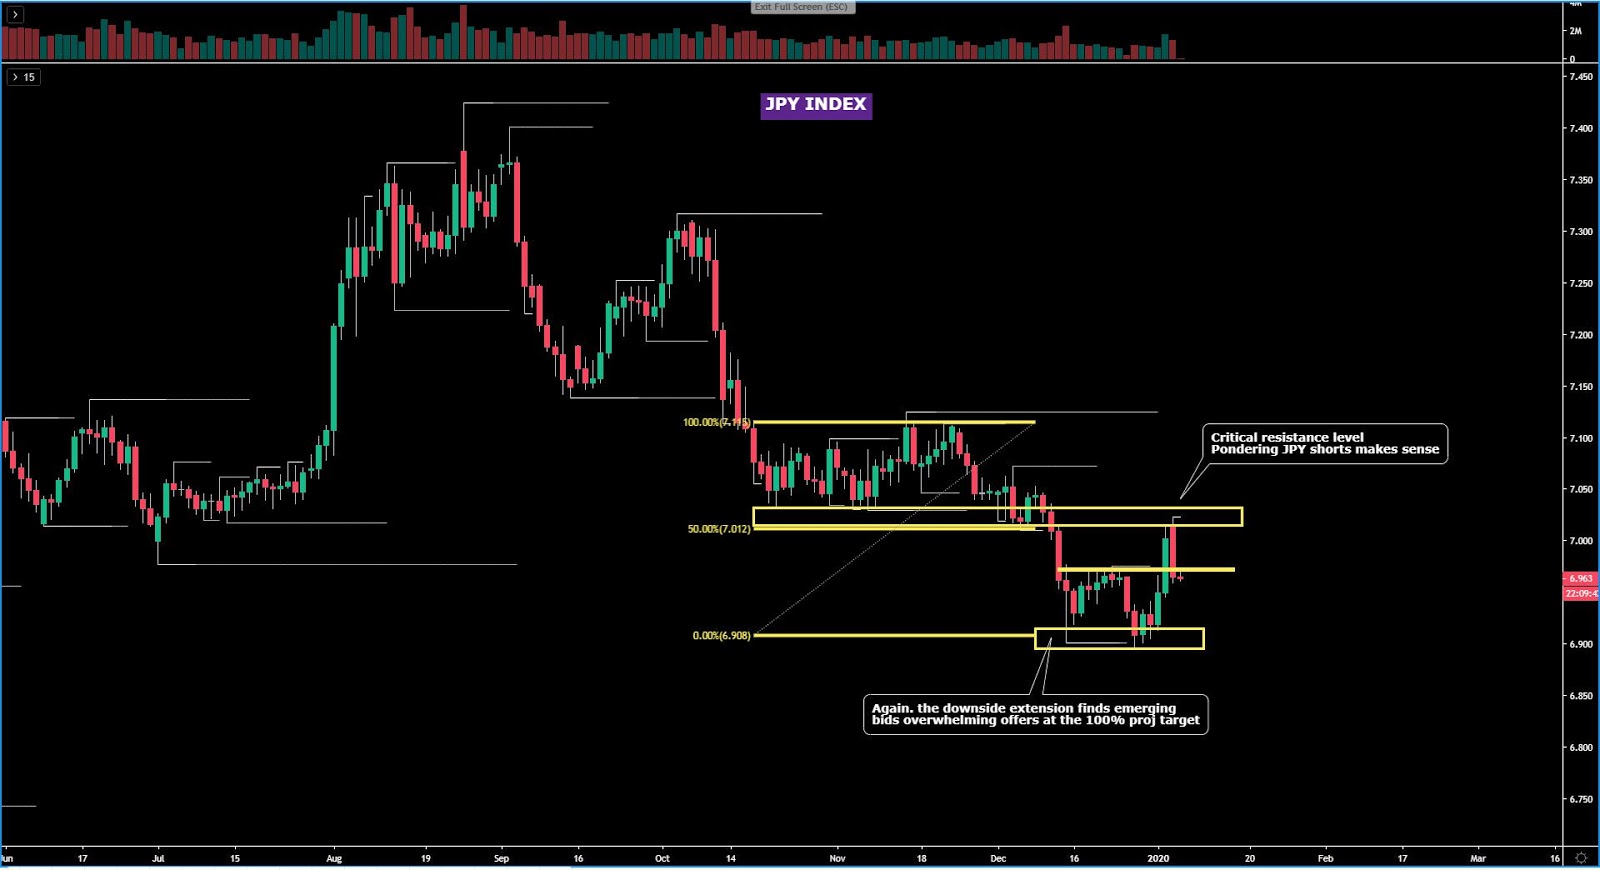
The JPY index has been taken to the woodshed on Monday by selling off across the board, and representative of this action, is the sizeable sell-side candle rejecting off resistance. The funding currency has seen its appeal evaporate amid the return of positive risk flows even if Trump is still sounding hawkish on his rhetoric against Iran. This plays into the view that Iran may end up being a sideshow the market will shrug off to instead re-calibrate the focus on the stabilization of global growth, which is positive for risk and asa result, tend to be a source of JPY selling pressure. As noted in yesterday’s report, if one maintains the overall macro bearish view in the currency, the area tested at the Asian early doors represented a very good attractive location to ponder some bearish ideas in the Yen given the significance of the resistance tested. Remember, the seasonal pattern for the Yen averages +0.25% in Jan since Jan ‘82. Note, there is still some merit to play JPY longs as the daily structure remains bullish at this stage.
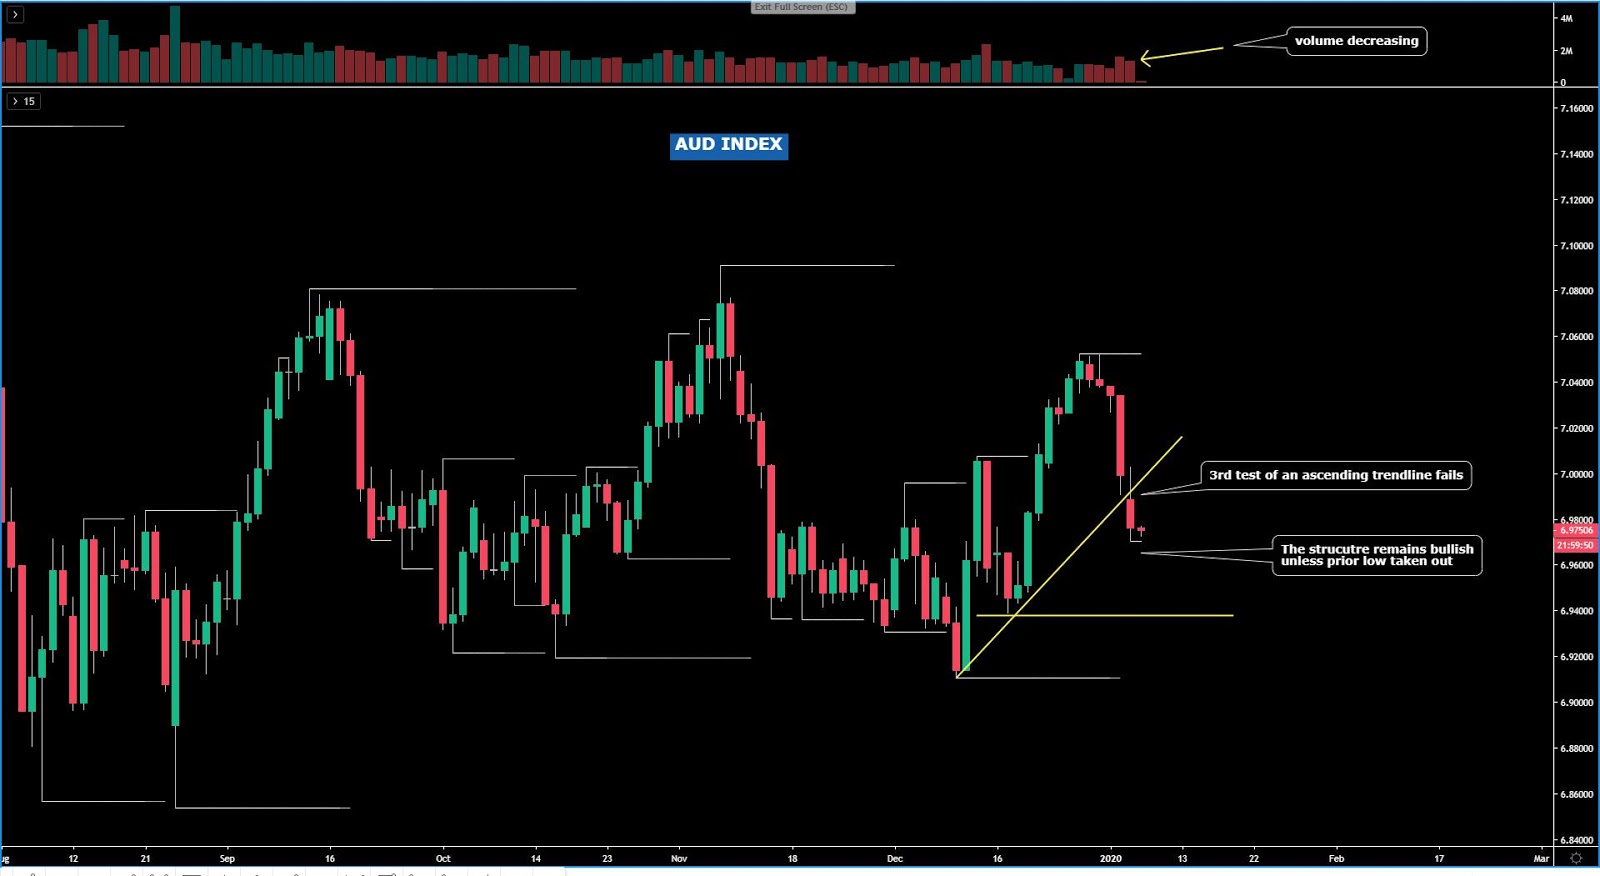
The AUD index was unsuccessful in finding buying interest at the intersection of an ascending trendline, with the price piercing through the level even if the technical picture still remains bullish overall as per the higher highs and higher lows printed since mid Dec. The breakout of the trendline does not carry high aggregate tick volume either, which makes the prospects for buyers to still emerge at these interesting valuation areas a scenario to consider. Note, in a reiteration of what I mentioned yesterday, that the current bullish cycle, with only 2 legs up, appears to be incomplete, hence long positions in the AUD vs the weakest links make sense. The forex seasonal pattern is positive to the tune of +0.54% in Jan since the early 1980s.
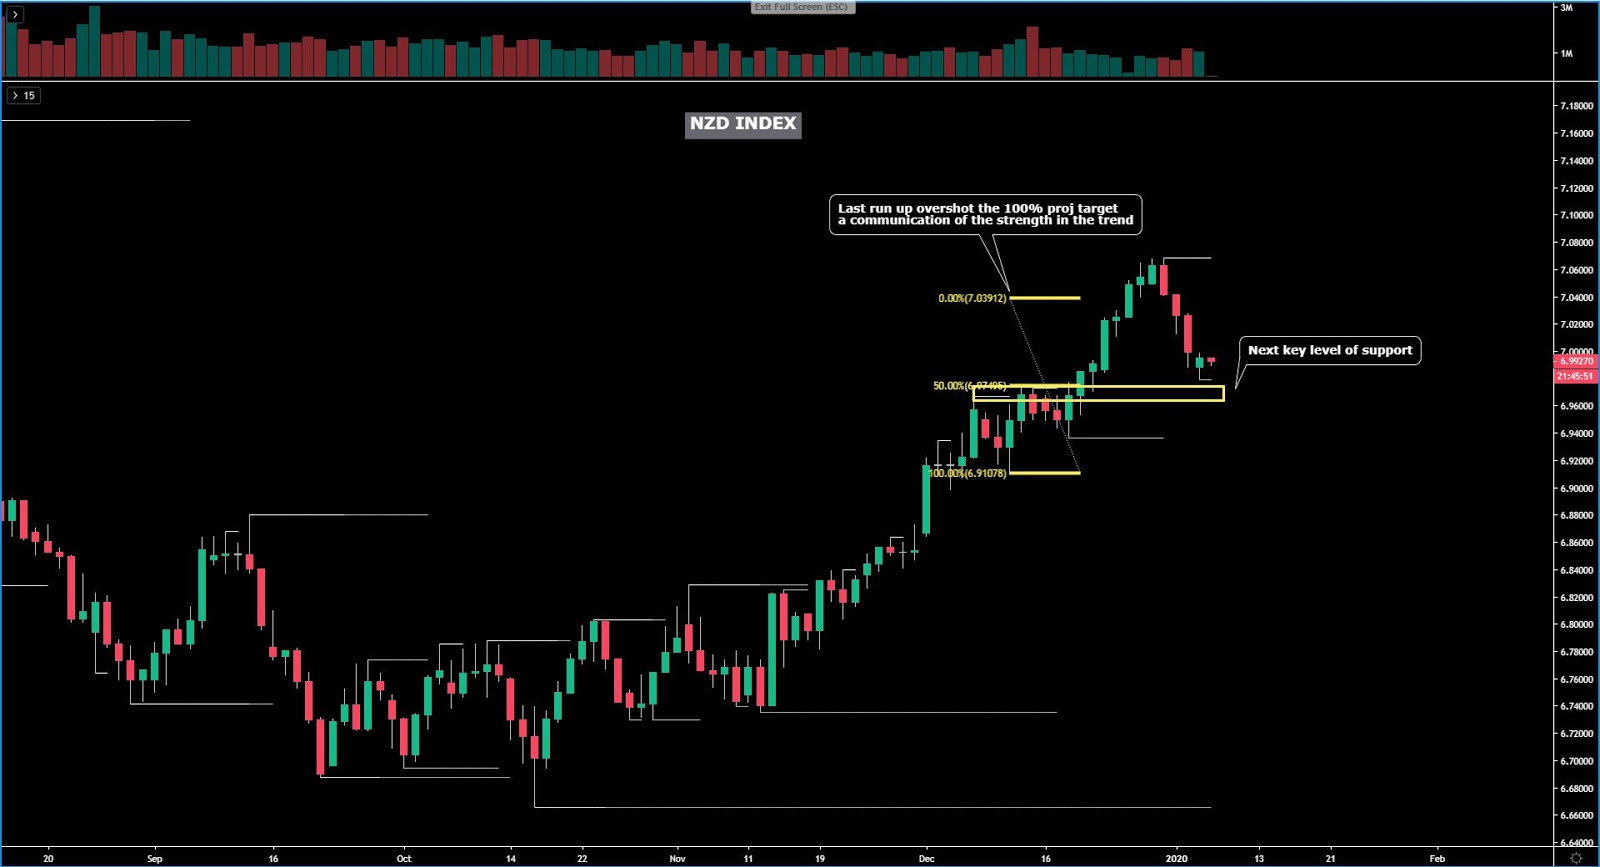
The NZD index found buyers on dips ahead of a key level of support as highlighted in the chart below. There is no reason to turn bearish on this market, a dangerous proposition at this stage based on what’s proven to be the best trend to play in the G8 FX space in Q4 ‘19. Remember, a measurement of strength in the NZD is the fact that the last run up overshot the 100% proj target, which makes the prospects of dip buying if price/volume agree a good value trade.
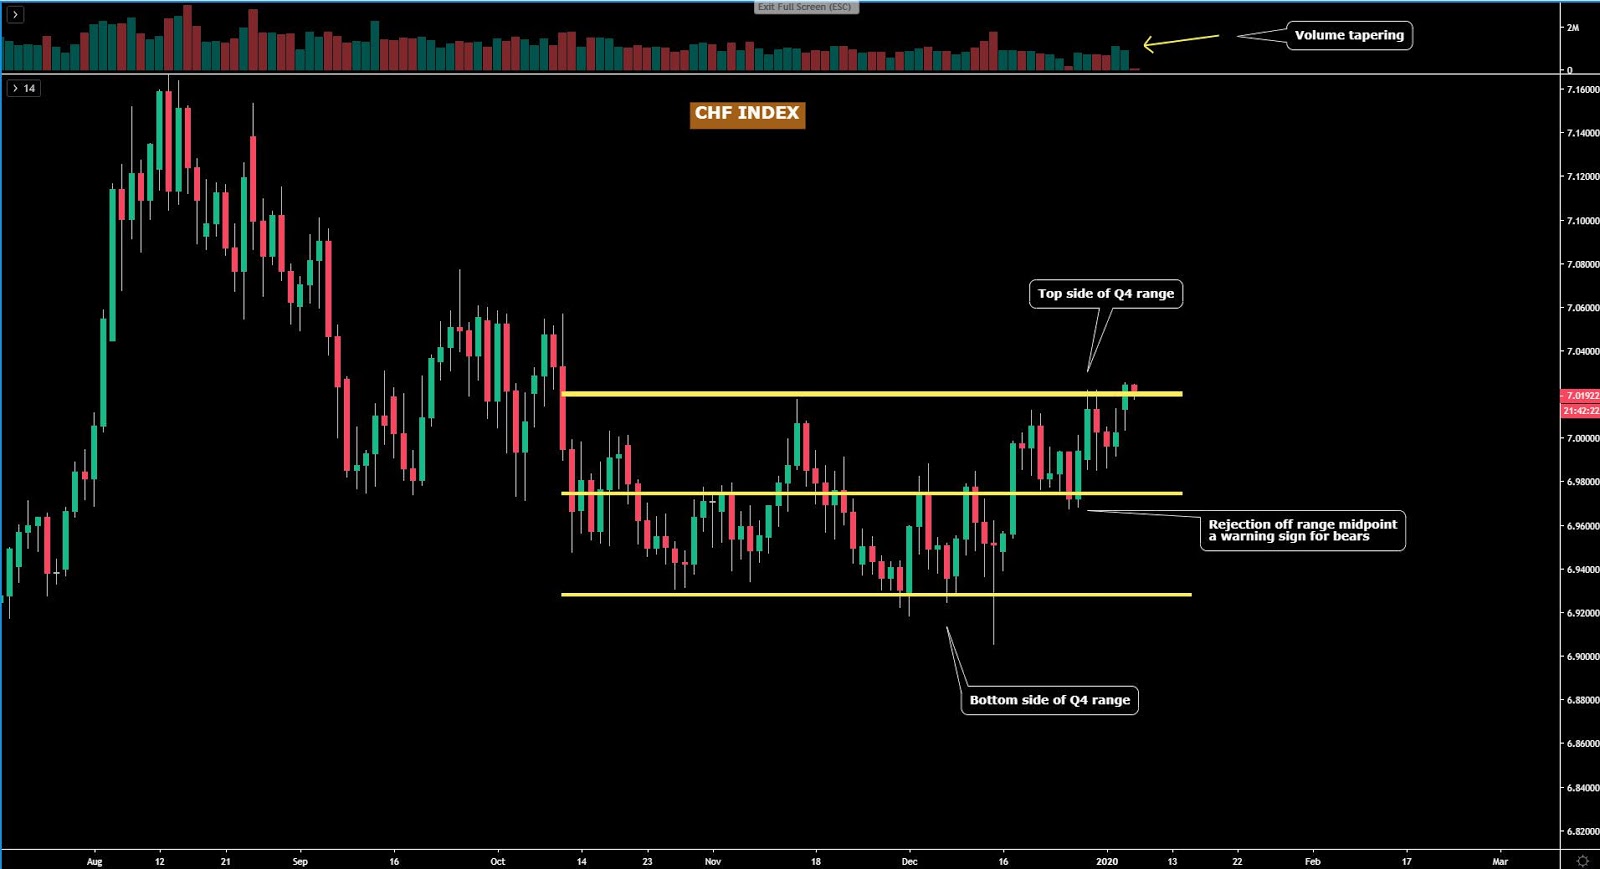
The CHF index keeps rising, marginally breaking the topside of its last quarter’s range, even if the low aggregate tick volume implies that further extensions are a dubious scenario. Personally, if I were to trade the CHF, I’d see this location as an attractive one to ponder shorts. Sooner or later, if the trend of stabilizing global growth ensues and carry trading returns, the CHF faces the clear risk of being sold as a result of the funding characteristics it offers (negative swap). The forex seasonals for CHF are not encouraging, with losses averaging 0.53% in Jan since 1982.
Important Footnotes
- Cycles: Markets evolve in cycles followed by a period of distribution and/or accumulation.
- Horizontal Support/Resistance: Unlike levels of dynamic support or resistance or more subjective measurements such as fibonacci retracements, pivot points, trendlines, or other forms of reactive areas, the horizontal lines of support and resistance are universal concepts used by the majority of market participants. It, therefore, makes the areas the most widely followed and relevant to monitor.
- Trendlines: Besides the horizontal lines, trendlines are helpful as a visual representation of the trend. The trendlines are drawn respecting a series of rules that determine the validation of a new cycle being created. Therefore, these trendline drawn in the chart hinge to a certain interpretation of market structures.
- Fundamentals: It’s important to highlight that the daily market outlook provided in this report is subject to the impact of the fundamental news. Any unexpected news may cause the price to behave erratically in the short term.
- Projection Targets: The usefulness of the 100% projection resides in the symmetry and harmonic relationships of market cycles. By drawing a 100% projection, you can anticipate the area in the chart where some type of pause and potential reversals in price is likely to occur, due to 1. The side in control of the cycle takes profits 2. Counter-trend positions are added by contrarian players 3. These are price points where limit orders are set by market-makers.
Related Articles
The Japanese yen is slightly lower on Wednesday. In the North American session, USD/JPY is trading at 148.92, down 0.07% on the day. What is the best performing G-10 currency...

USD/JPY is consolidating near 149.33 on Wednesday, with the yen pausing its rally while holding near four-month highs against the USD. This stabilisation follows renewed support...

The US stock market stabilized yesterday, but there were no significant moves during the US session as speculators remained neutral ahead of Nvidia (NASDAQ:NVDA) earnings, which...
Are you sure you want to block %USER_NAME%?
By doing so, you and %USER_NAME% will not be able to see any of each other's Investing.com's posts.
%USER_NAME% was successfully added to your Block List
Since you’ve just unblocked this person, you must wait 48 hours before renewing the block.
I feel that this comment is:
Thank You!
Your report has been sent to our moderators for review



Add a Comment
We encourage you to use comments to engage with other users, share your perspective and ask questions of authors and each other. However, in order to maintain the high level of discourse we’ve all come to value and expect, please keep the following criteria in mind:
Enrich the conversation, don’t trash it.
Stay focused and on track. Only post material that’s relevant to the topic being discussed.
Be respectful. Even negative opinions can be framed positively and diplomatically. Avoid profanity, slander or personal attacks directed at an author or another user. Racism, sexism and other forms of discrimination will not be tolerated.
Perpetrators of spam or abuse will be deleted from the site and prohibited from future registration at Investing.com’s discretion.