- Euro speculators most short since June 2013
- AUD speculators most long since May 2013
- MXN speculators most long since June 2013
- Non Commercials (speculators) – Red
- Commercials – Blue
- Small Speculators – Black
- COTDiff (COT Index) – Black
View COT data in MT4
Latest CFTC Release dated June 10, 2014:
|
Week (Data for Tuesdays) |
52 week Percentile / Comment (if applicable) |
|
28 |
|
|
0 – specs are most net short in a year |
|
|
90 |
|
|
100 – specs are most net long in over a year |
|
|
41 |
|
|
63 |
|
|
4 |
|
|
100 – specs are most net long in a year |
|
|
41 |
|
|
20 |
|
|
43 |
|
|
96 |
The COT Index is the difference between net speculative positioning and net commercial positioning measured. A light blue colored bar indicates that the difference in positioning is the greatest it has been in 52 weeks (bullish) with speculators selling and commercials buying. A light red colored bar indicates that the difference in positioning is the greatest it has been in 52 weeks (bearish) with speculators buying and commercials selling. Crosses above and below 0 are in bold. Non commercials tend to be on the wrong side at the turn and commercials the correct side.
Charts (all charts are continuous contract)
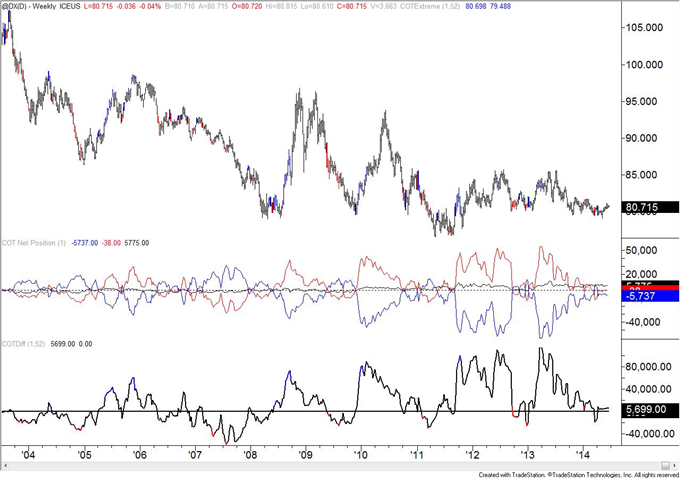
Chart prepared by Jamie Saettele, CMT
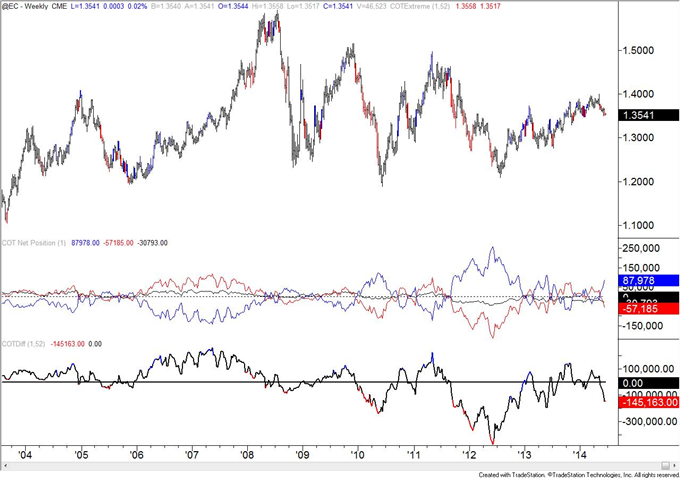
Chart prepared by Jamie Saettele, CMT
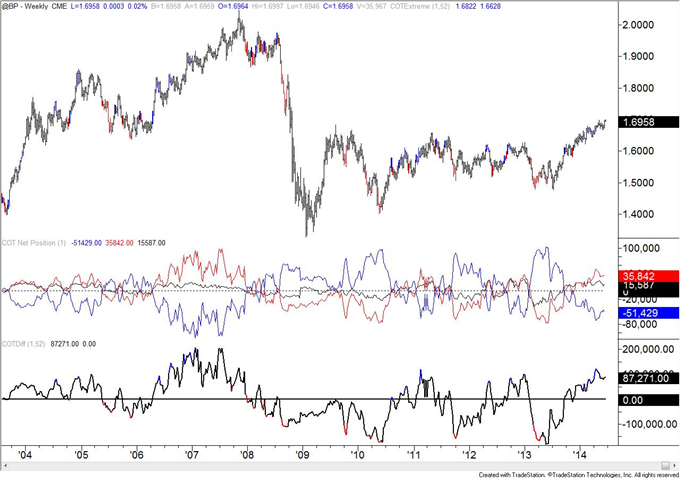
Chart prepared by Jamie Saettele, CMT
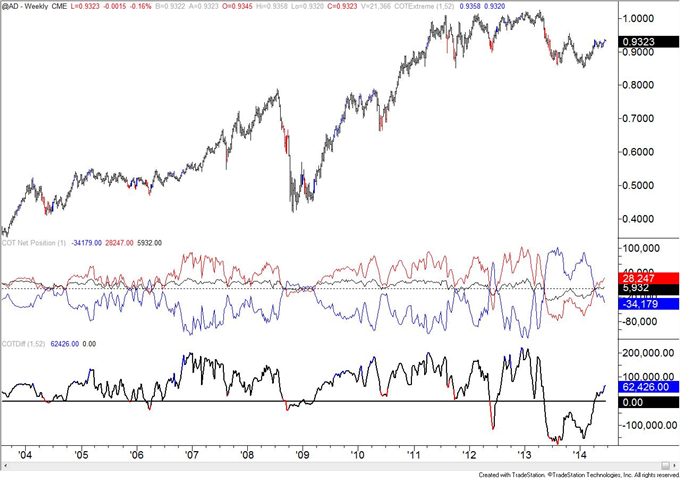
Chart prepared by Jamie Saettele, CMT
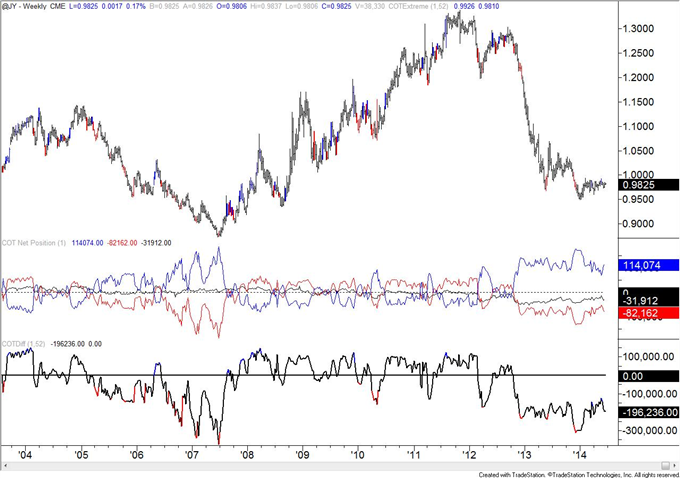
Chart prepared by Jamie Saettele, CMT
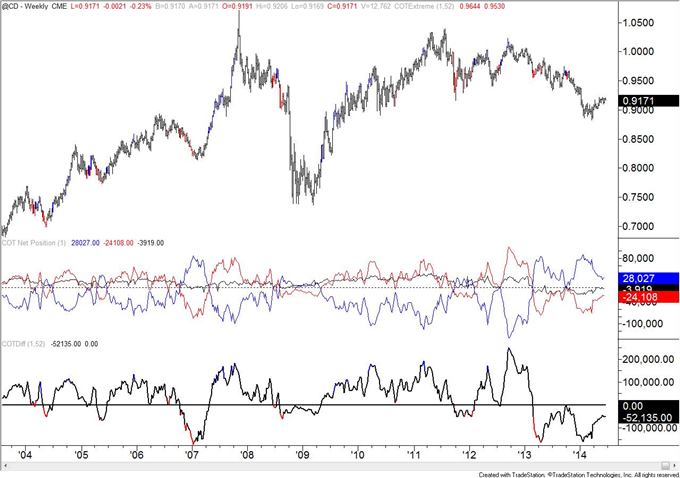
Chart prepared by Jamie Saettele, CMT
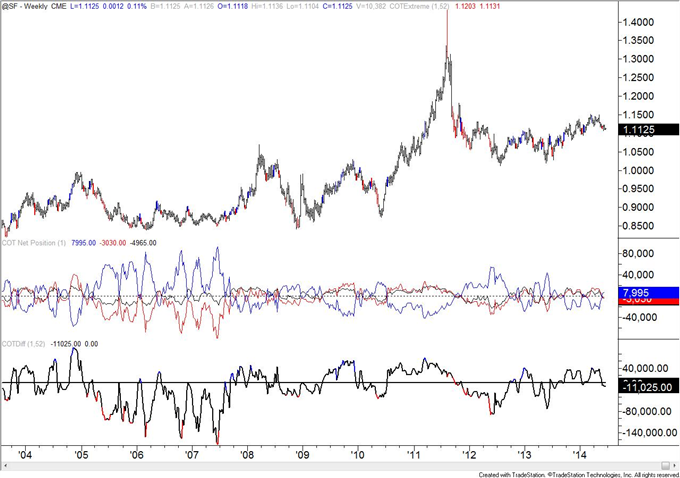
Chart prepared by Jamie Saettele, CMT
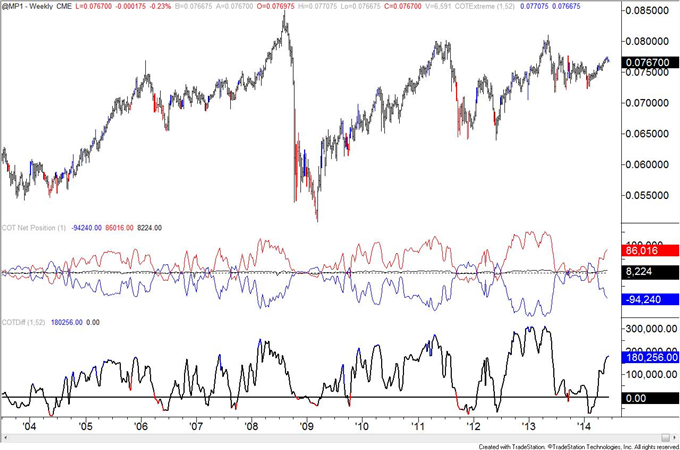
Chart prepared by Jamie Saettele, CMT
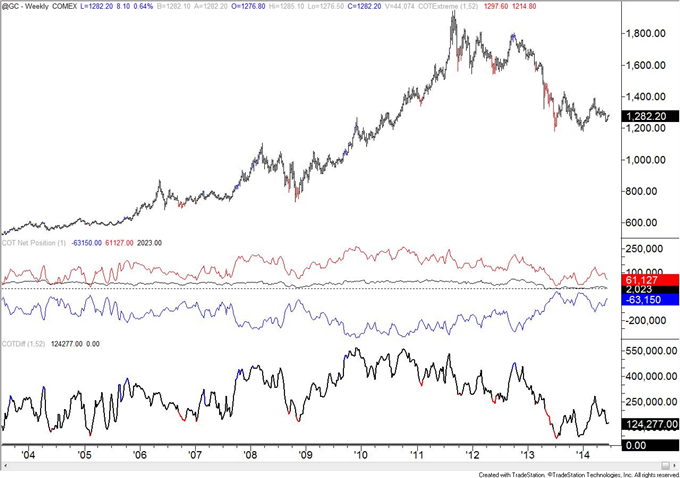
Chart prepared by Jamie Saettele, CMT
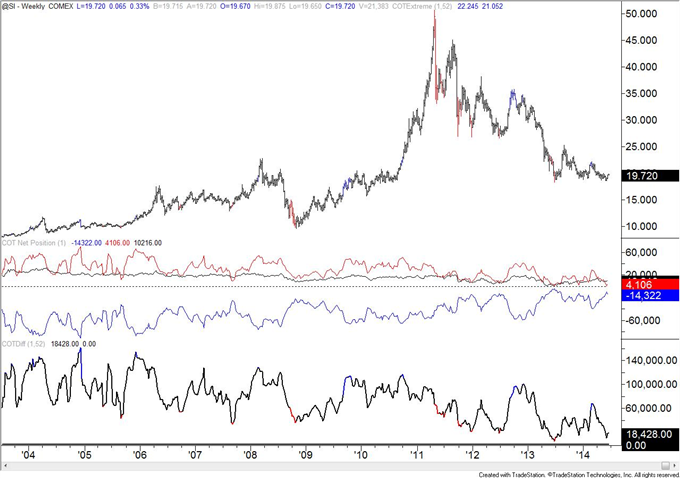
Chart prepared by Jamie Saettele, CMT
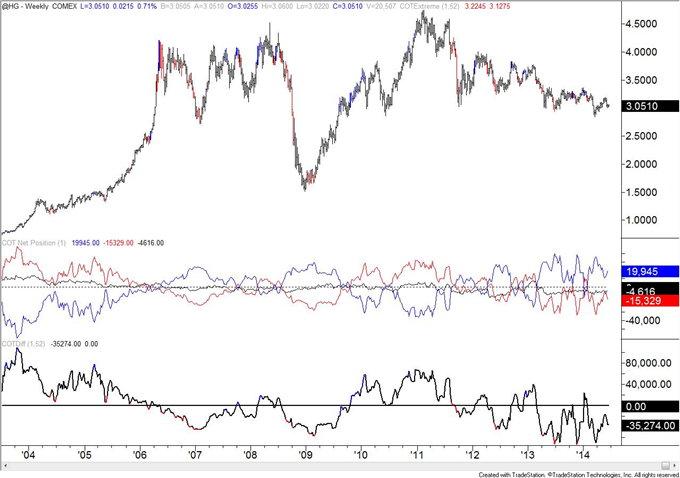
Chart prepared by Jamie Saettele, CMT
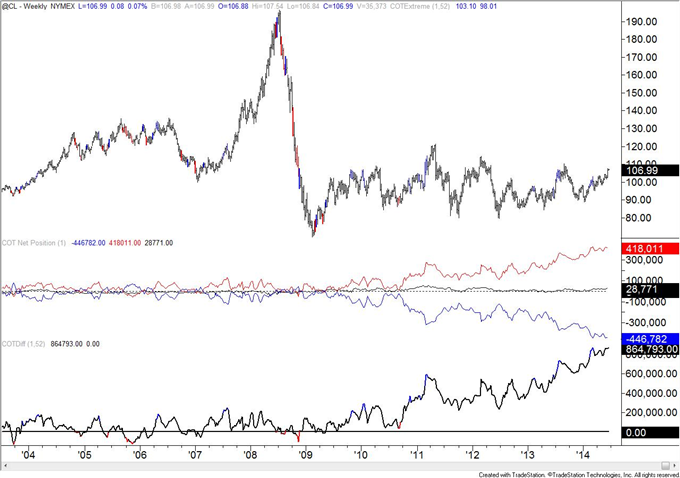
Chart prepared by Jamie Saettele, CMT
--- Written by Jamie Saettele, CMT, Senior Technical Strategist for DailyFX.com
