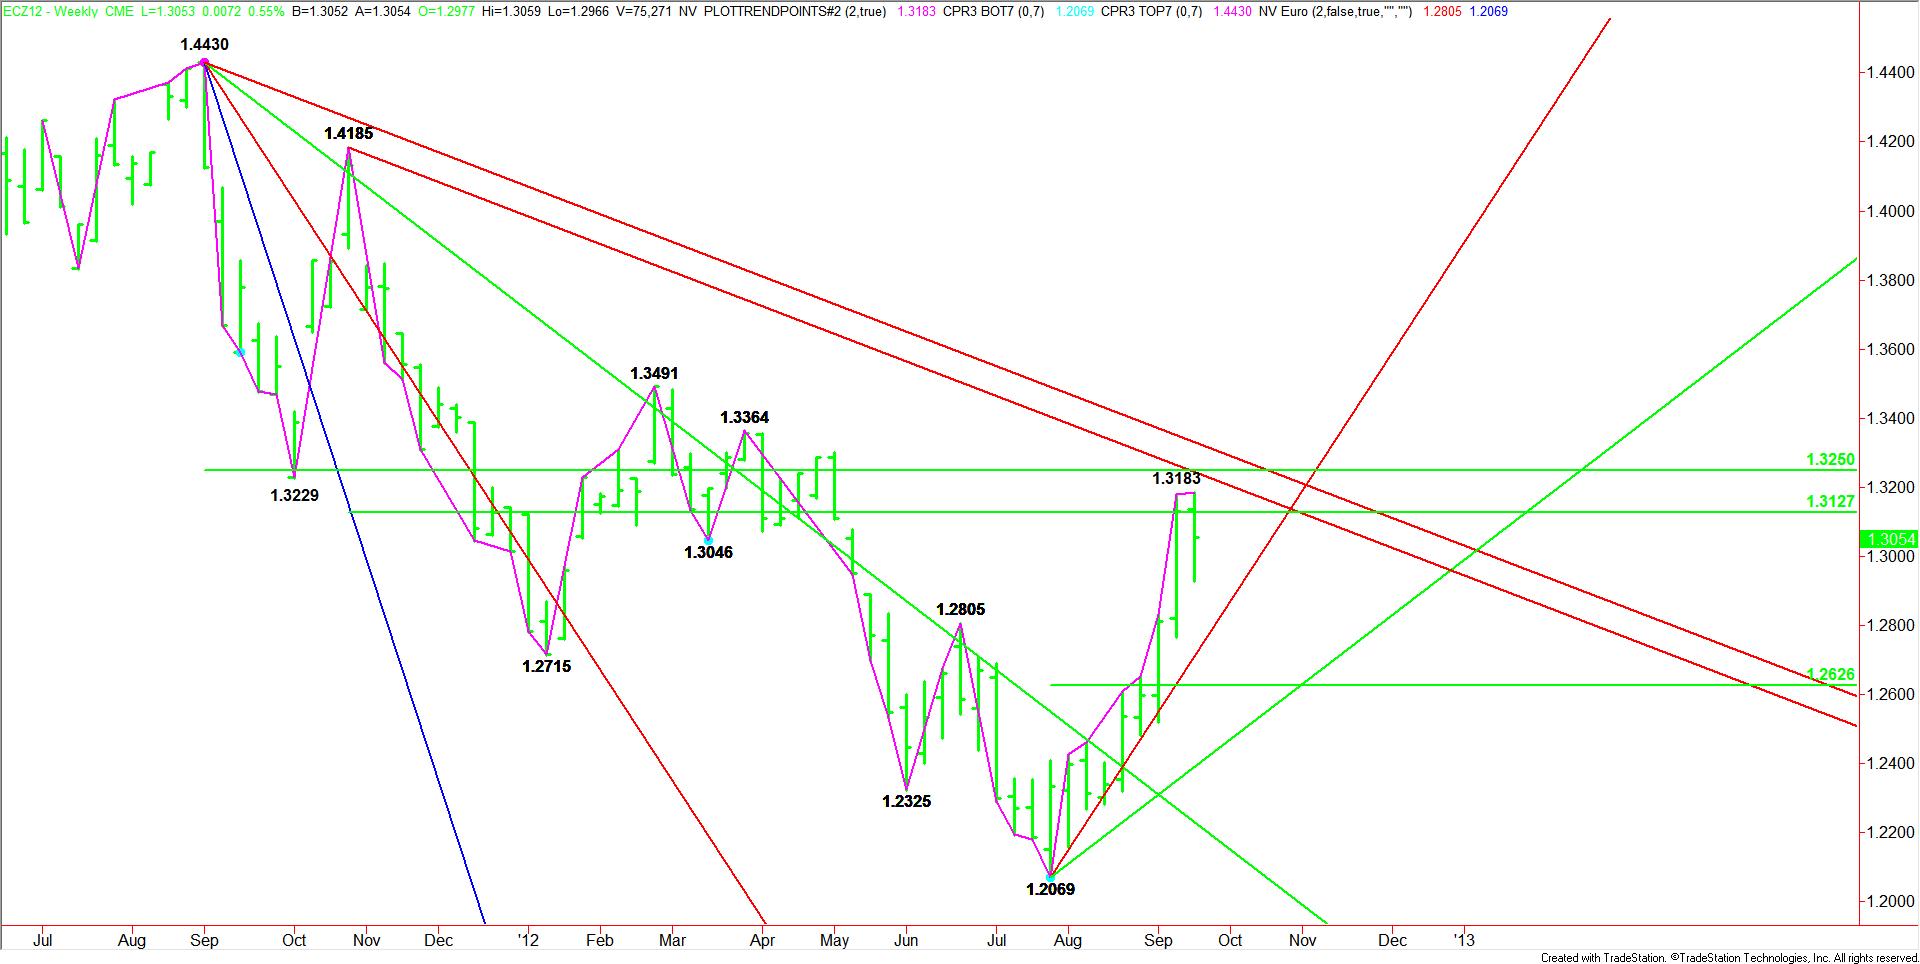
Following an eight-week rally from the July bottom at 1.2069, the December Euro is in a position to post a weekly closing price reversal top. This chart pattern often leads to the start of a two-to-three week correction equal to at least 50% of the last rally.
The main reason the closing price reversal top was created was because the Euro had reached a major 50% retracement level. Based on the 1.4185 to 1.2069 range, the first upside objective of the rally was 1.3127. Another range from 1.4430 to 1.2069 created a 50% level at 1.3250. So the rally to 1.3183 fell in between both of these key retracement levels. The 50% retracement price is often considered to be a natural selling level as long typically exit at this price and aggressive shorts enter the market.
Besides the horizontal resistance levels, the December Euro was also facing diagonal resistance in the form of a pair of downtrending Gann angle at 1.3245 and 1.3330. Although they weren’t actually touched, just their presence near the retracement zone may have encouraged long traders to bail out of their positions.

Bearish Scenario
Although a close below 1.3128 will mean a lower close for the week, a close below 1.3057 will represent the most bearish scenario. If the Euro closes below this level and follows through to the downside next week then traders should expect to see a 50% correction of the rally from 1.2069 to 1.3183 over the next 2 to 3 weeks. This downside target is 1.2626. Before the market even reaches this price it must break through an uptrending Gann angle at 1.2709.
As you can see, the Euro went just about as far as it could when it reached the 50% retracement zone at 1.3127 to 1.3250 so the selling was a natural reaction to this event. The closing price reversal top doesn’t mean a change in trend is taking place. Since the main trend turned up on the weekly chart a few weeks ago when it broke through 1.2805, the expected break is going to be a correction of the rally from 1.2069 to 1.3183. This means that buyers may be waiting at the downside target price at 1.2626 to refresh their exited long positions.
Our study of chart pattern suggests that it will take at least three to five weeks to actually form a top that could lead to a change in trend. The first clue that a major top is forming will be the creation of a “M” pattern.
The main reason the closing price reversal top was created was because the Euro had reached a major 50% retracement level. Based on the 1.4185 to 1.2069 range, the first upside objective of the rally was 1.3127. Another range from 1.4430 to 1.2069 created a 50% level at 1.3250. So the rally to 1.3183 fell in between both of these key retracement levels. The 50% retracement price is often considered to be a natural selling level as long typically exit at this price and aggressive shorts enter the market.
Besides the horizontal resistance levels, the December Euro was also facing diagonal resistance in the form of a pair of downtrending Gann angle at 1.3245 and 1.3330. Although they weren’t actually touched, just their presence near the retracement zone may have encouraged long traders to bail out of their positions.

Bearish Scenario
Although a close below 1.3128 will mean a lower close for the week, a close below 1.3057 will represent the most bearish scenario. If the Euro closes below this level and follows through to the downside next week then traders should expect to see a 50% correction of the rally from 1.2069 to 1.3183 over the next 2 to 3 weeks. This downside target is 1.2626. Before the market even reaches this price it must break through an uptrending Gann angle at 1.2709.
As you can see, the Euro went just about as far as it could when it reached the 50% retracement zone at 1.3127 to 1.3250 so the selling was a natural reaction to this event. The closing price reversal top doesn’t mean a change in trend is taking place. Since the main trend turned up on the weekly chart a few weeks ago when it broke through 1.2805, the expected break is going to be a correction of the rally from 1.2069 to 1.3183. This means that buyers may be waiting at the downside target price at 1.2626 to refresh their exited long positions.
Our study of chart pattern suggests that it will take at least three to five weeks to actually form a top that could lead to a change in trend. The first clue that a major top is forming will be the creation of a “M” pattern.
