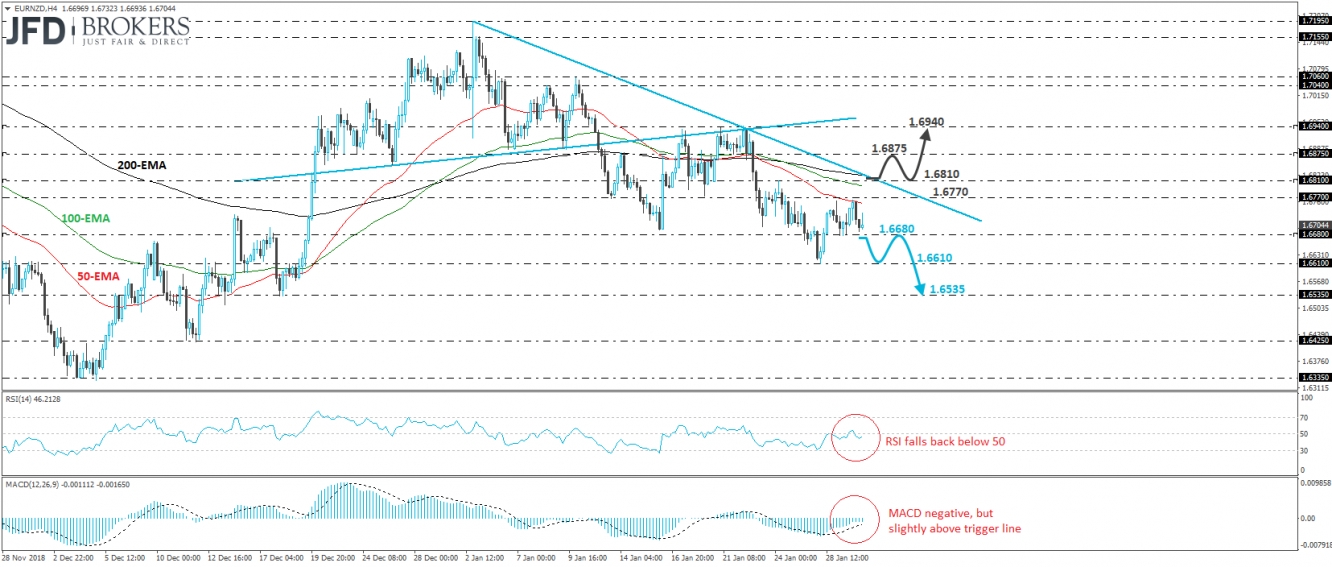
EUR/NZD traded lower on Wednesday, after it hit resistance near the 50-EMA, fractionally below the 1.6770 barrier. On January 11, the pair fell below the neckline of a “head and shoulders” formation and since then, it continued trading below the downside resistance line taken from the peak of January 2. Even though the rate rebounded strongly on January 16, the recovery stayed limited near the aforementioned neckline, that way keeping the overall near-term outlook negative.
At the time of writing, the pair is trading slightly above the 1.6680 support hurdle, marked by yesterday’s low, the break of which may open the path towards the low of January 28th, at around 1.6610. Another move lower, below 1.6610, would confirm a forthcoming lower low on the 4-hour chart and is possible to carry bearish extensions towards the 1.6535 territory, which stopped the rate from moving lower on December 18.
Shifting attention to our short-term momentum studies, we see that the RSI fell back below its 50 line, but ticked somewhat up again. The MACD lies fractionally below zero, but above its trigger line. Although it shows signs of topping, combined with the tick up in the RSI, this indicator supports our choice to wait for a dip below 1.6680 before we get confident on further declines.
On the upside, we would like to see a decisive break above 1.6810 before we start examining whether the bulls have abandoned the battlefield, at least in the short run. Such a move could confirm the break above the downside line drawn from the high of January 2 and may initially pave the way towards 1.6875. If that zone fails to stop the bulls from traveling higher, its break may allow further advances, perhaps towards the key zone of 1.6940. That area proved a decent resistance from December 17 until December 22.

