It was November 30th, 2018, when we last talked about EUR/NZD. The pair was trading near 1.6570, following a sharp selloff from as high as 1.7929 in less than two months. After such a huge and fast decline, traders were understandably very pessimistic about the pair’s prospects going into December.
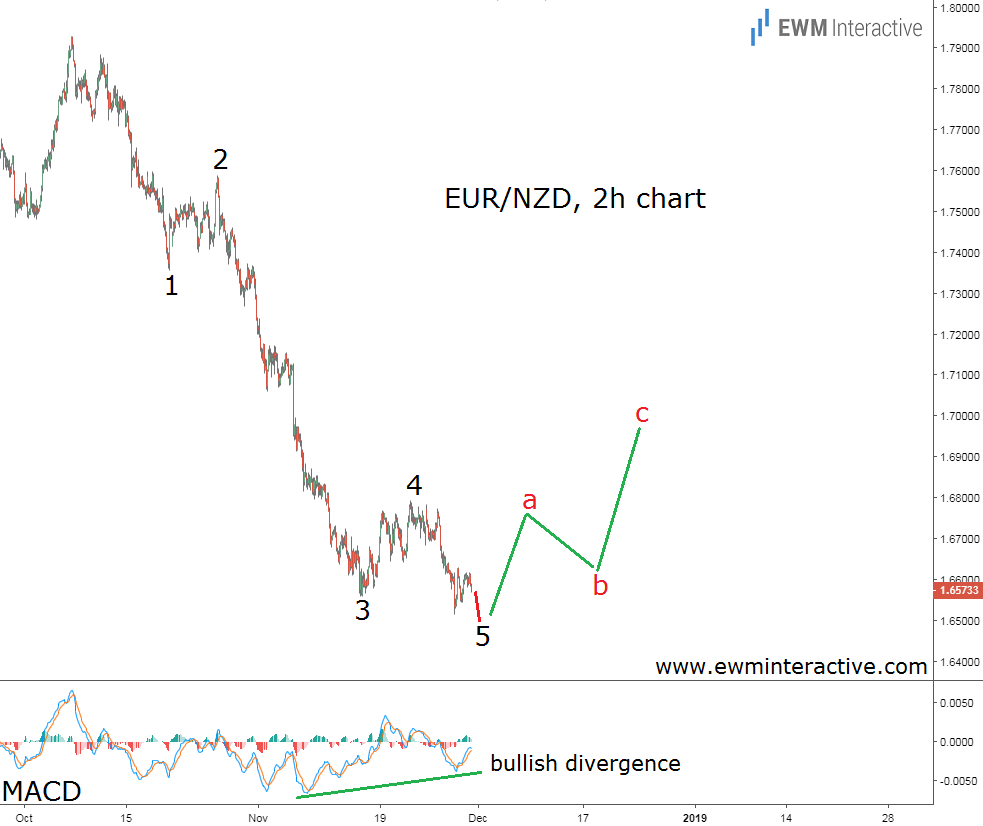
However, extrapolation is a dangerous thing in the markets. The past is not always a good indication of the future. So instead of joining the bears, we were looking for Elliott Wave signs on the EUR/NZD chart below, published in this article over two months ago.

This chart revealed that the structure of the decline from 1.7929 was impulsive. According to the Elliott Wave principle, every impulse is followed by a three-wave correction in the opposite direction. In addition, the MACD indicator was flashing a strong bullish divergence between waves 3 and 5.
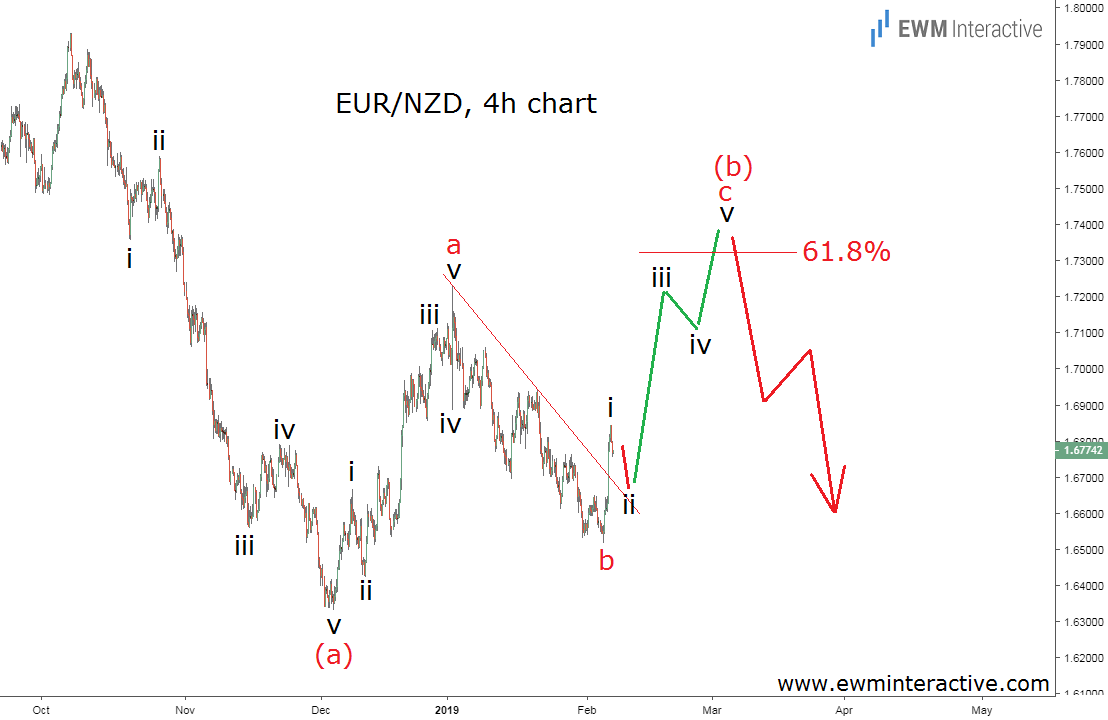
We thought short sellers were overestimating their ability to keep EUR/NZD under pressure. Our analysis suggested “1.7000 is going to be within the bulls’ reach going forward.” The updated chart below shows how things went.

December turned out to be even more successful for the bulls than we expected. EUR/NZD climbed from 1.6454 to 1.7111 during the last month of 2018 and then reached 1.7229 on January 3rd. But the chart above indicates the three-wave rally in wave (b) is still in progress.
“Three-wave” is the keyword, because EUR/NZD has only drawn two waves, labeled a-b, from the bottom of wave (a) at 1.6330. This means that in order to fulfill the 5-3 wave cycle from the top at 1.7929, the bulls still have to lift the pair to a new swing high in wave “c” of (b).
EUR/NZD The Big Picture
The 61.8% Fibonacci level near 1.7400 seems like a natural bullish target from now on. On the other hand, once the bearish cycle is complete, another significant plunge should be expected in wave (c) down. Now, let’s see where would all this fit into the big picture outlook.

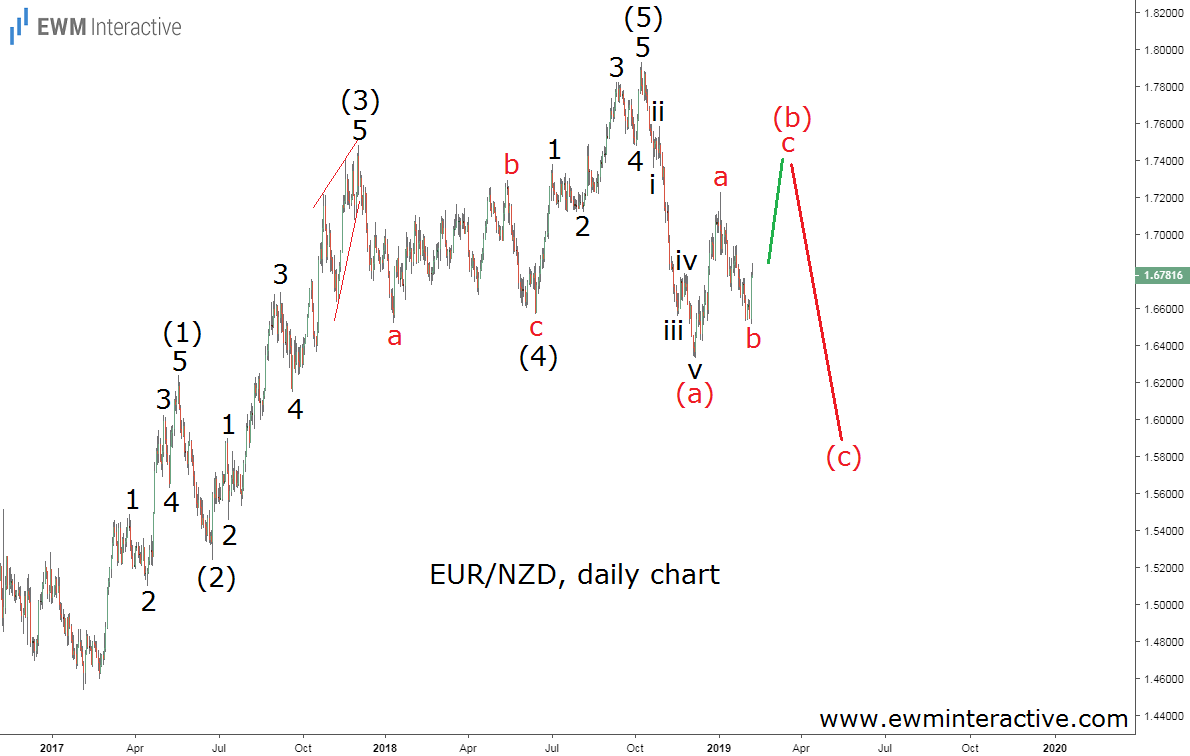
The daily chart of EUR/NZD allows us to put the three-wave (a)-(b)-(c) decline we just discussed into the proper context. It visualizes that the weakness from 1.7929 is actually part of the corrective phase of a larger 5-3 wave cycle, which has been in progress since the bottom at 1.4536 in February 2017.
This impulse pattern is labeled (1)-(2)-(3)-(4)-(5) and the five sub-waves of waves (1), (3) and (5) are clearly visible, as well. While the 4-hour chart helped us identify 1.7400 as a probable area for a bearish reversal, the daily chart provides a target area for wave (c) around 1.6000.
If this analysis is correct, February should be just as enjoyable for the bulls as December was. The bad news is that the big corrective retracement from 1.7929 is still in progress towards 1.6000 in the longer term.
