NVDA Q3 Earnings Alert: Why our AI stock picker is still holding Nvidia stockRead More

EUR/JPY Trades Slightly Below 118.85

Published 02/18/2020, 07:34 AM
Updated 07/09/2023, 06:31 AM
EUR/JPY
-

EUR/JPY had been trading in a consolidative manner, between 118.85 and 119.20, since February 13th. Today, the rate dipped slightly below 118.85, but rebounded to oscillate around that zone. Overall, EUR/JPY is trading below the downside resistance line drawn from the high of January 17th, as well as below the prior medium-term upside one taken from the low of September 3rd. So, having all these technical signs in mind, we would consider the short-term picture to be negative.

If the bears manage to distance themselves from the 118.85 hurdle, we could see them diving towards the 118.45 area, defined as a support by the inside swing peak of September 27th. If they are not willing to throw their swords away and push below that level as well, the slide may get extended towards the 118.10 territory, marked by the inside swing high of October 9th.

Taking a look at our short-term oscillators, we see that the RSI turned down and touched its toe back below the 30 line, while the MACD, although above its trigger line, shows signs of topping within its negative territory. Both indicators suggest that the rate may start picking strong downside speed again, which enhances our view for some further near-term declines.

On the upside, we would like to see a strong recovery above the downside line drawn from the high of January 17th before we start examining whether the bulls have gained the upper hand. Such a break may see scope for extensions towards the high of February 10th, at around 120.35. The bulls may decide to take a break after hitting that zone, and thereby allow a setback. Nonetheless, as long as such a potential setback stays limited above the pre-mentioned downside line, we would expect the bulls to charge again and push above the 120.35 zone, perhaps targeting the 120.65 obstacle, marked by the peak of February 5th.
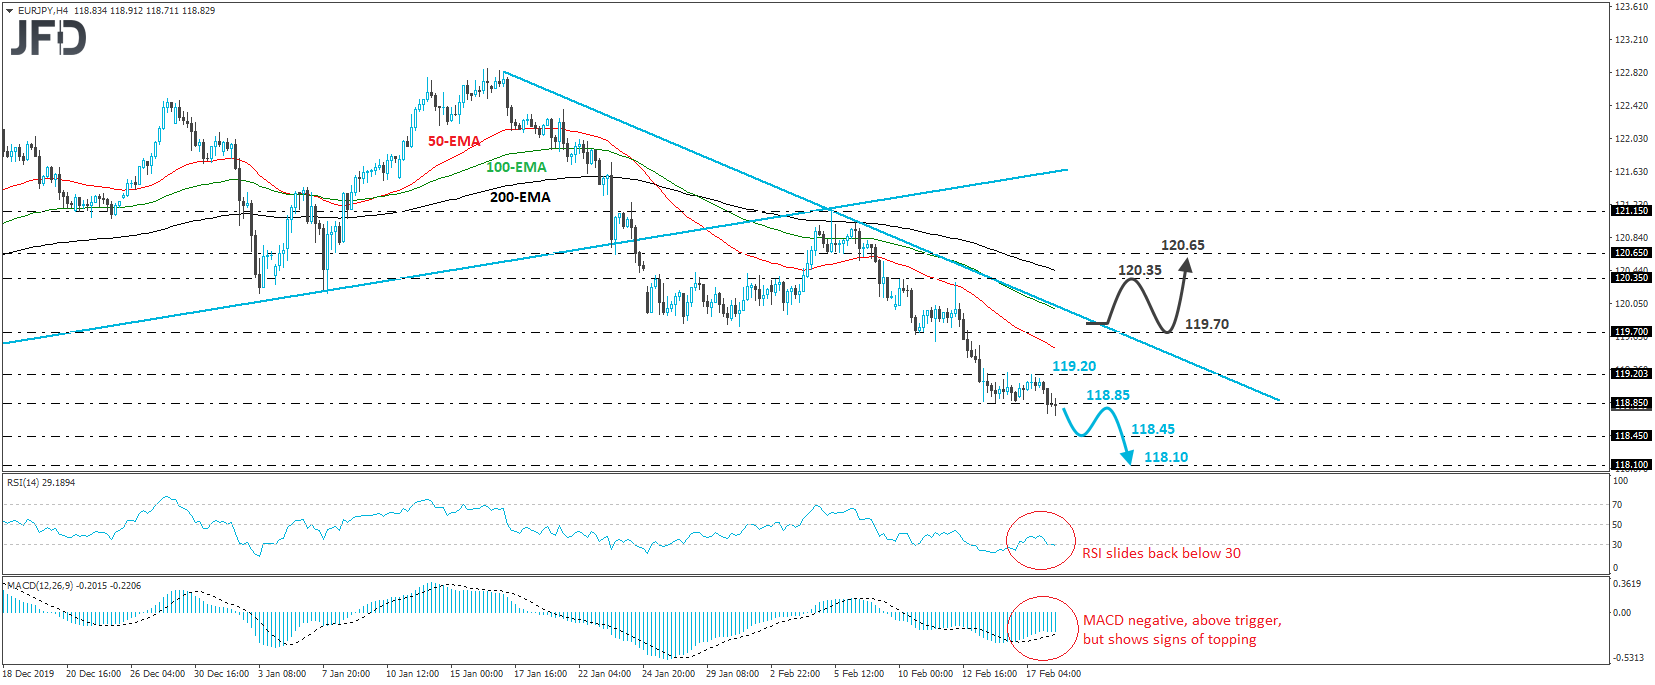
EUR/JPY 4-hour chart technical analysis

Latest comments

Loading next article…
Risk Disclosure: Trading in financial instruments and/or cryptocurrencies involves high risks including the risk of losing some, or all, of your investment amount, and may not be suitable for all investors. Prices of cryptocurrencies are extremely volatile and may be affected by external factors such as financial, regulatory or political events. Trading on margin increases the financial risks.
Before deciding to trade in financial instrument or cryptocurrencies you should be fully informed of the risks and costs associated with trading the financial markets, carefully consider your investment objectives, level of experience, and risk appetite, and seek professional advice where needed.
Fusion Media would like to remind you that the data contained in this website is not necessarily real-time nor accurate. The data and prices on the website are not necessarily provided by any market or exchange, but may be provided by market makers, and so prices may not be accurate and may differ from the actual price at any given market, meaning prices are indicative and not appropriate for trading purposes. Fusion Media and any provider of the data contained in this website will not accept liability for any loss or damage as a result of your trading, or your reliance on the information contained within this website.
It is prohibited to use, store, reproduce, display, modify, transmit or distribute the data contained in this website without the explicit prior written permission of Fusion Media and/or the data provider. All intellectual property rights are reserved by the providers and/or the exchange providing the data contained in this website.
Fusion Media may be compensated by the advertisers that appear on the website, based on your interaction with the advertisements or advertisers.
© 2007-2024 - Fusion Media Limited. All Rights Reserved.