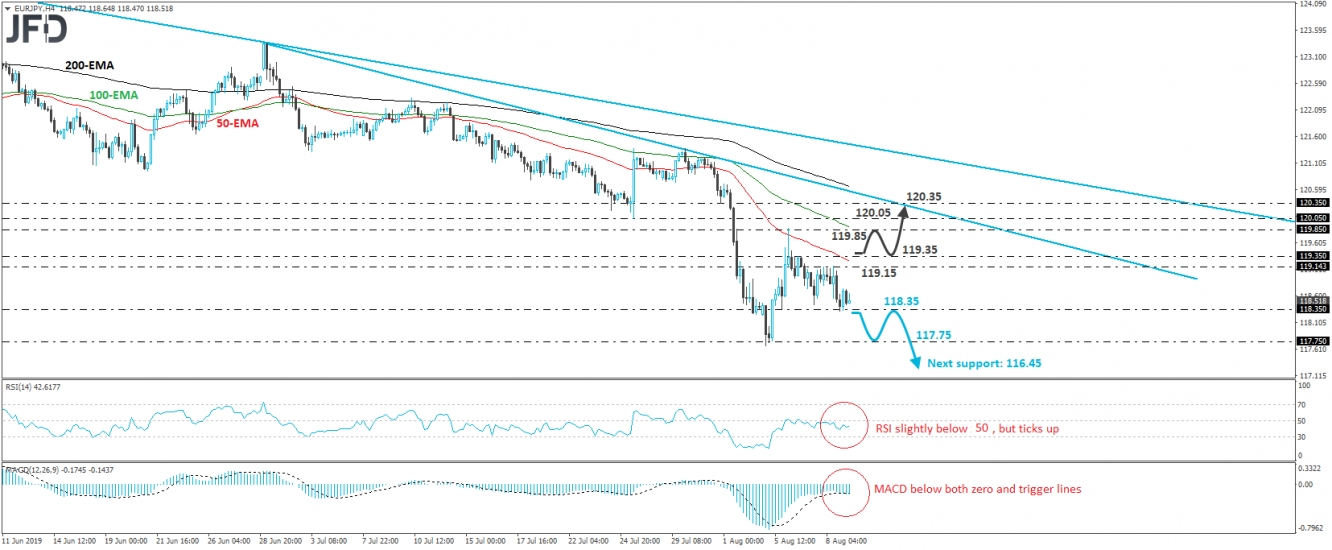
EUR/JPY traded lower yesterday, after it hit resistance once again at the 119.15 barrier. That said, the slide was stopped near the 118.35 level, and then the pair rebounded somewhat. Overall, the price structure continues to suggest a downtrend, as marked by the downside line drawn from the high of April 17th, as well as by a shorter-term one, taken from the peak of July 1st.
If the bears are strong enough to drive the battle below 118.35, we may see them targeting the 117.75 area, near Monday’s low. The rate could bounce from that hurdle, but if the bears decide to reenter the action from below 118.35, we would see decent chances for the forthcoming negative leg to overcome the 117.75 zone. This could carry larger bearish implications and may set the stage for extensions towards the low of April 21st, 2017, at around 116.45.
Taking a look at our short-term oscillators, we see that the RSI lies slightly below 50, but it has just ticked up. The MACD lies within its negative territory, slightly below its trigger line. Both indicators detect negative momentum and corroborate our view for further declines, but the fact that the RSI ticked up suggests that a small bounce may be in the works before the next negative leg.
In order to start examining the case of a decent positive correction though, we would like to see a clear break above 119.35. Such a move could initially open the path towards the 119.85 zone, near the high of August 6th, the break of which may allow the bulls to test the 120.05 barrier, marked by the inside swing low of July 25th, or the downside resistance line taken from the high of July 1st.

