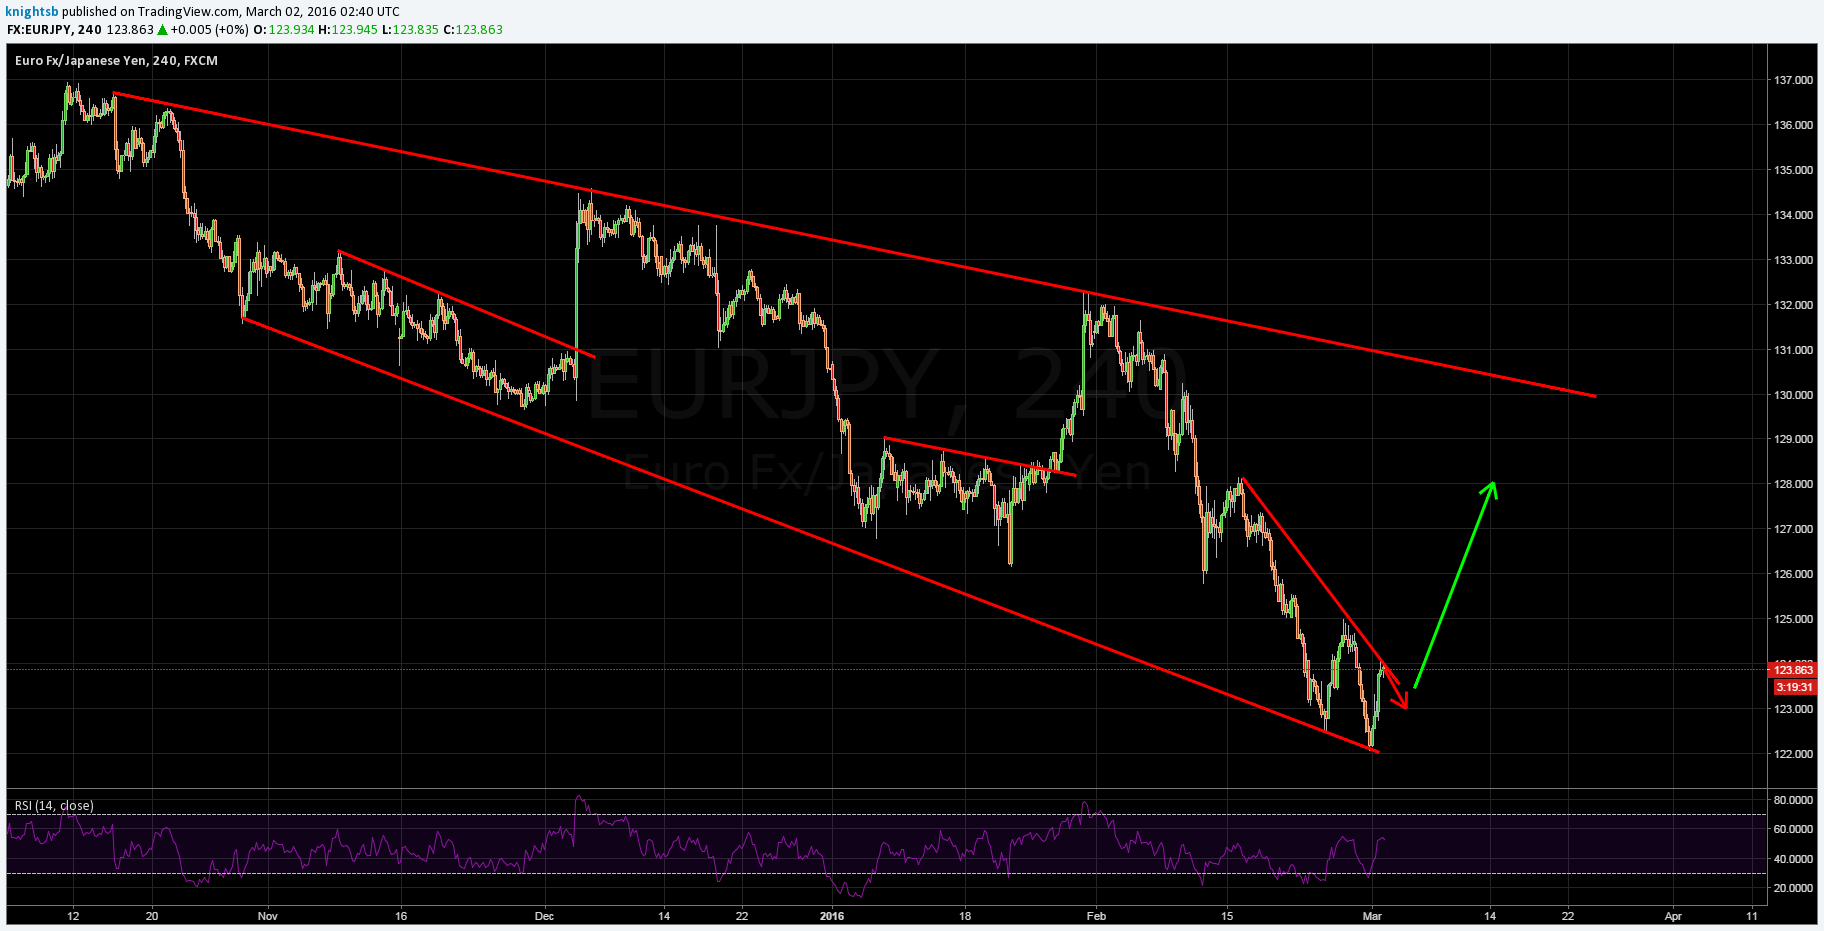
Yen denominated pairs have had a tough few weeks as continued depreciation and rampant speculation over central bank intervention has taken its toll. However, the EURJPY charts are starting to signal a potential breakout in progress that could set the pair up for some significant gains.
As the currency pair has continued to fall over the past few months, a number of large breakouts have occurred from the bottom of the channel. In each example, there has been a relatively consistent downtrend with lots of validation, before a breakout above the trend line results in a sharp climb to the top of the channel. Subsequently, keen traders will note that the past few sessions have resulted in a similar trade setup.
Taking a look at the 4-Hour chart demonstrates a similar pattern emerging towards the bottom of the constraining channel. Subsequently, a break of the short term bearish trend line could signal a significant and sharp bullish move. Further supporting the bullish contention is the emergence of some divergence within the MACD indicator that could be signalling a move ahead.
In fact, there is also a wave pattern apparent on the chart with price action currently within the “C” wave of the corrective structure. At this time, it looks as if the “C” has just completed and we could be facing the final D leg of the move. Subsequently, there is likely to be a small pullback ahead of any challenge to the trend line.

Fundamentals also largely support a short term rally given that most of the large Japanese banks have signalled their belief that the yen depreciation slide is largely over given the strength in Japans current accounts. However, as always with economics, it pays to monitor the details closely especially given the BoJ’s history of shocking markets with stimulus.
Ultimately, the trade setup provides an interesting confluence of factors in the form of price action’s location at the bottom of the channel as well as the current MACD divergence. Subsequently, watch the pair closely for a small pullback and then a sharp and rapid challenge of the short term trend line. Entries should be kept above the 124 handle with upside targets at both 125.00 and 128.17 in extension.
Which stock should you buy in your very next trade?
With valuations skyrocketing in 2024, many investors are uneasy putting more money into stocks. Unsure where to invest next? Get access to our proven portfolios and discover high-potential opportunities.
In 2024 alone, ProPicks AI identified 2 stocks that surged over 150%, 4 additional stocks that leaped over 30%, and 3 more that climbed over 25%. That's an impressive track record.
With portfolios tailored for Dow stocks, S&P stocks, Tech stocks, and Mid Cap stocks, you can explore various wealth-building strategies.
