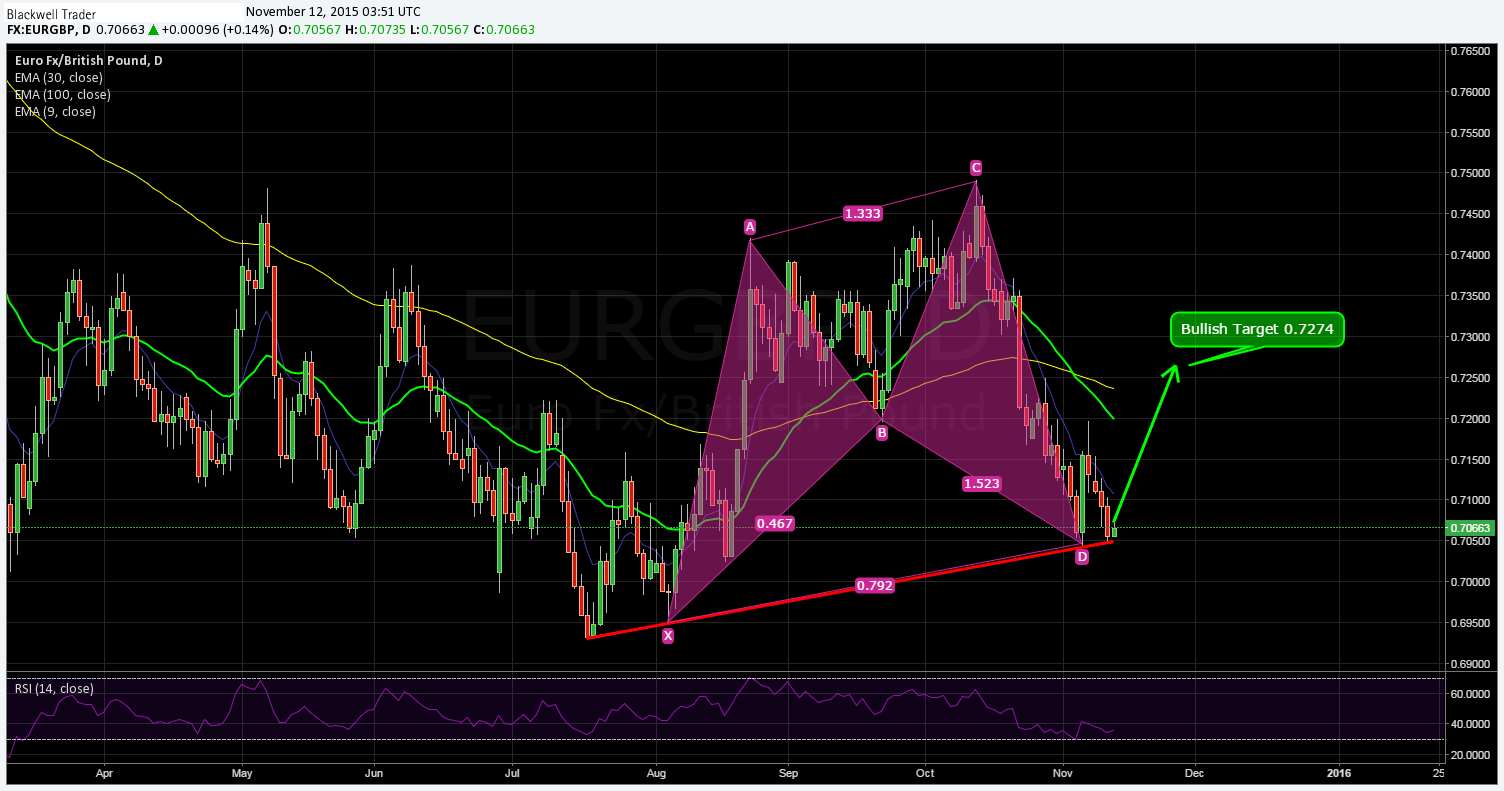
The EUR/GBP has fallen strongly over the past week, breaking through several key technical levels as it was impacted by the resurgent pound. However, a double bottom has just appeared on the daily chart which could indicate a buoyant currency pair in the days to come.
November has been a relatively down month for the embattled pair, as suggestions from the ECB that QE is likely to be expanded, have taken their toll upon the currency. Despite some buoyant economic data from the Eurozone, the pair has continued to drift lower towards the psychological 70 cent handle, entering a key area of support.
The EUR/GBP’s price action has been largely constrained within a channel that has restricted its movements. Currently, the pair has retreated to touch the bottom of the channel at 0.7050, and it now looks ripe for a strong retracement. In fact, the EUR/GBP has actually formed a double bottom that coincides with both the bottom of the channel, as well as an area of support at 0.7055. Subsequently, there is plenty of scope for a bullish retracement given the pairs current position and the fact that RSI has now climbed out of the oversold zone.
Determining the entry for a large structure is always difficult, however the current neckline of the double bottom actually coincides with the 23.6% Fibonacci retracement level at 0.7147. Subsequently any breach of this key level, on the upside, could signal a bullish leg in progress.

In the near term, the EUR/GBP will need to surmount resistance at 0.7147, 0.7223, and 0.7283 to confirm a move higher. Any subsequent breach of the double bottom’s neckline could see these key resistance levels coming quickly into play.
Regardless of how this pattern plays out, any bounce or retracement from the supporting channel line is likely to provide plenty of trading opportunities in the coming days. However, keep a close watch on the pending US Unemployment Claims figures, although not directly related to the pair, the resulting volatility may impact capital flows generally.
