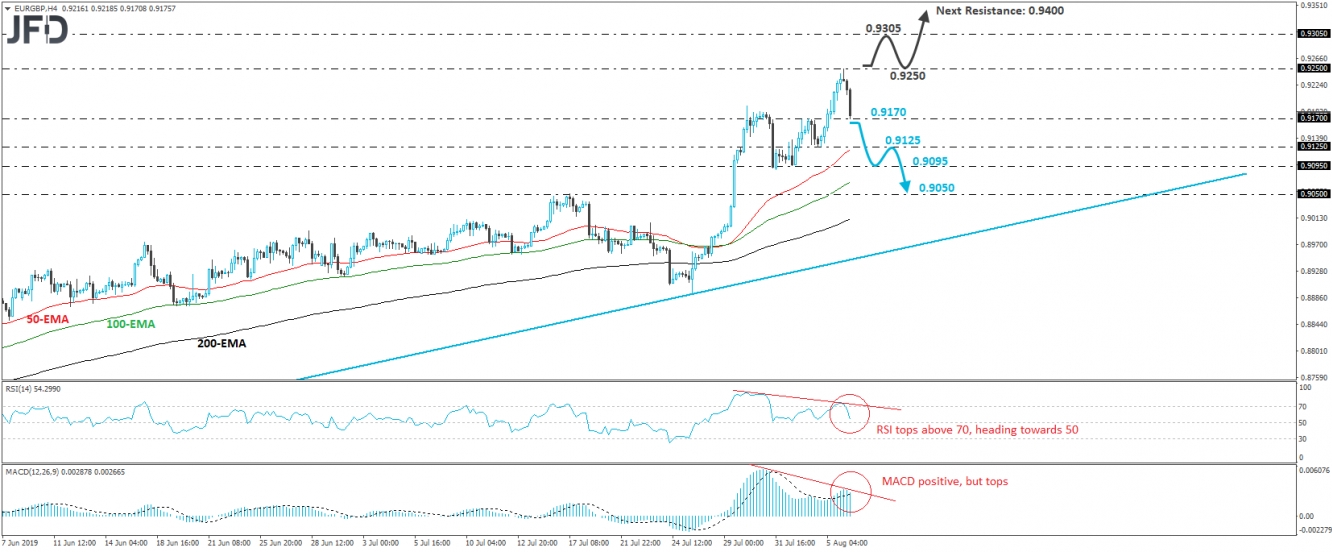
EUR/GBP traded in a rally mode on Monday, but today, during the Asian morning, it hit resistance at 0.9250 and corrected lower to hit support at 0.9170, marked by Friday’s peak. Although the price structure remains higher peaks and higher troughs well above the tentative upside support line drawn from the low of May 6th, given the clear negative divergence between our momentum studies and the price action, we would expect the current retreat to continue for a while more.
If the bears are strong enough to push the rate below 0.9170, we may see them initially aiming for yesterday’s low of 0.9125, the break of which could extend the slide towards the 0.9095 zone, near the lows of July 31st and August 1st. Another dip, below 0.9095, could carry more bearish implications, perhaps paving the way towards the 0.9050 hurdle, defined by the inside swing peak of July 17th.
Shifting attention to our short-term oscillators, we see that the RSI topped within its above-70 zone, dipped below 70, and it now looks to be heading towards 50. The MACD, although above both its zero and trigger lines, has topped and appears ready to fall below its trigger soon. Alongside the aforementioned negative divergence, these signs support the case for a larger negative correction.
On the upside, a strong recovery above 0.9250 would suggest that the bears have left the battlefield earlier, as it would confirm a forthcoming higher high and signal the continuation of the prevailing longer-term uptrend. Such a move could see scope for bullish extensions towards the peak of August 29th, 2017, the break of which may pave the way towards the 0.9400 area. That area was last tested almost a decade ago, back in October 2009.

