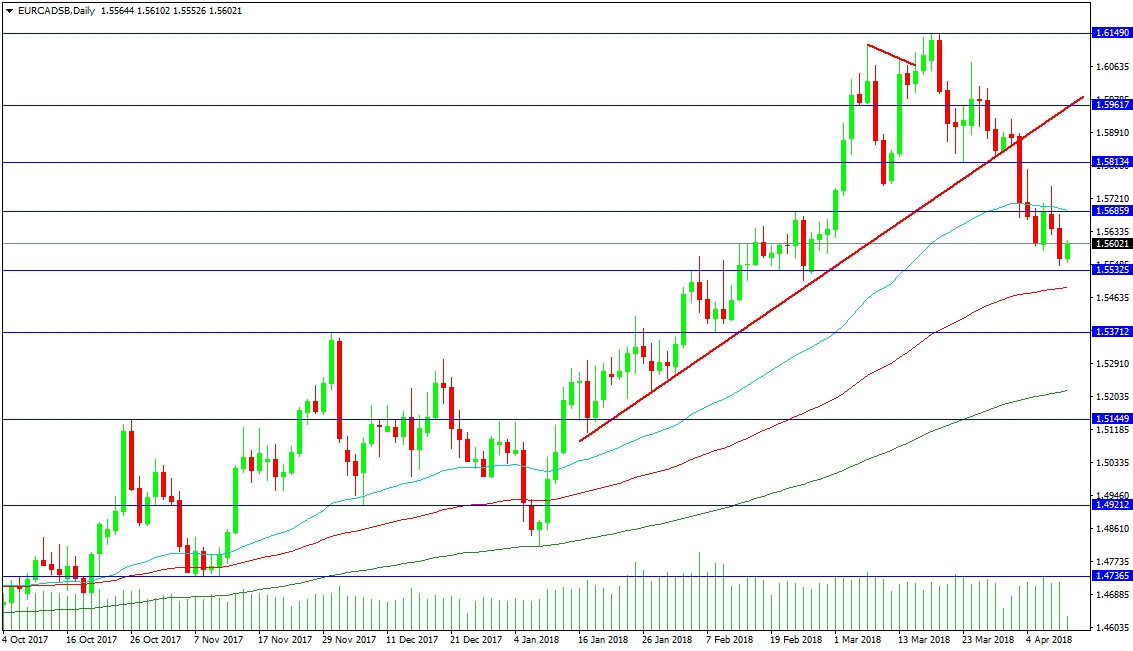
The EUR/CAD pair has fallen back under the red supporting trend line, leading to a down move to the 1.55500 support area. The low reached 1.55458 but there is support close by at 1.55325. Price action is now back to the 1.56000 level. Resistance comes in the form of the 50 DMA at 1.56860, with the 1.58134 level an important low from late March. An upward move through this area targets the red ascending trend line at 1.59617, followed by the 1.60000 level and the high for 2018 at 1.61490.
Support at the 100 DMA is found at 1.54876, with the 1.53712 level of resistance from late 2017 coming in as support, which was tested in February. The 200 DMA was used in early January as support and there is no reason to think that it won’t be used again if price drops that far. A loss of this area can see a determined sell-off target the 1.50000 area, followed by 1.47365 and 1.45000.
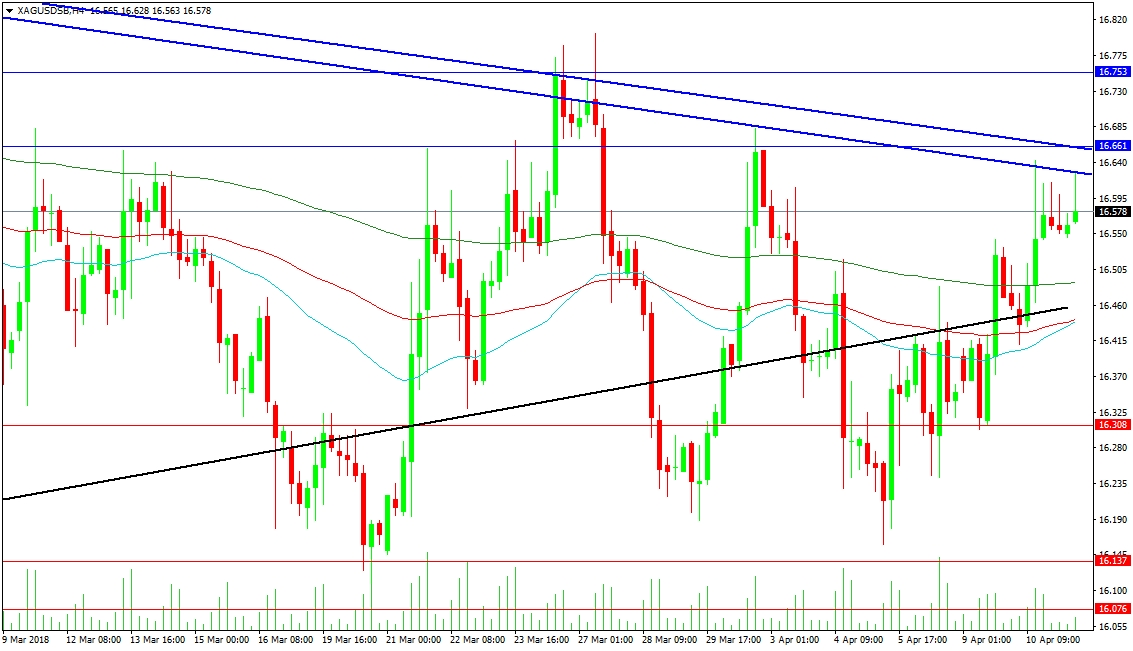
The metal has formed an unusual but common enough double trend line pattern over the last few weeks. The most recent touch on the lower of the two blue trend lines was earlier today, with the area representing strong resistance around 16.650. A break above here targets 16.750, followed by 16.800. This would lead to a retest of the 17.000 level, and higher to 17.500.
Support can be seen at the 200-period MA at 16.489, with the rising black trend line at 16.460 supported by the 100 and 50 MA at 16.440. A loss of this area would see price move to test 16.300, followed by 16.137 and 16.076. The 16.000 area represents strong psychological support, a loss of which could see 15.610 tested, followed by 15.000.


