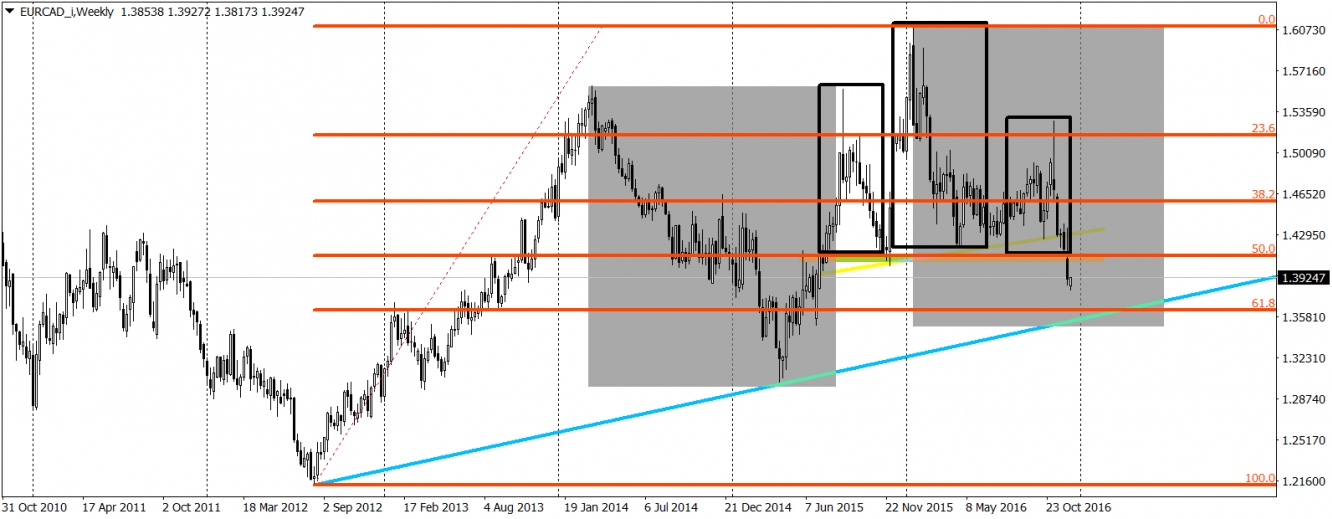
Last week for the EUR/CAD was not very successful. Strong bearish candlestick on the W1 chart seems to highlight the direction for the next few weeks. Bearish view is also supported by other factors. First one is the Head and Shoulders formation (black rectangles). Formation is active because the neck line (yellow) was already broken. What is more, recent downswing broke an important horizontal support on the 50% Fibonacci retracement. With this kind of price action, we can anticipate that the price will continue to fall and try to make a correction equality movement (grey areas). What is even more interesting, is that the potential correction equality can happen on the longterm (from 2012) up trendline (blue). To this area we still have 300-400 pips, so it is never too late to jump in for this kind of movement.
New week started with a local bullish correction. This creates an opportunity for the sellers to use better prices for the transaction. I would not be surprised if the price would like to come back to the neck line and test this level as the closest resistance. It happens very often with the head and shoulders formation. In the perfect world of the price action trading, for the next few weeks we would see a nice sequence of an upswing, test of the neck line, then a downswing aiming for the up trendline. I cannot see a reason why we should not experience that on this example here in reality, not only in the technical analysis almanacs.

