After starting a pretty strong uptrend back on the 17th of Jan., price was hovering around 1.2650 before it launched up almost 700pips in less than a month gaining 66% of those days. Price then consolidated between 1.3040-ish and 1.3224 for 7 days but then broke out with a vigor suggesting likely sustained break which can be seen in the chart below.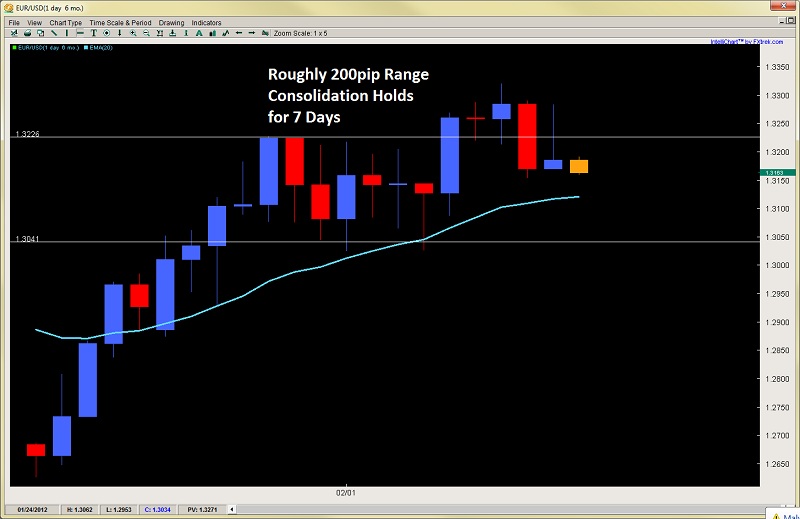
But then things got a little peculiar. First off, the breakout bar although strong and closed near the high, had very little clearing distance suggesting it may not have taken out the stops above nor given the market confidence it had done enough damage to the bears. Then, it formed a doji as the first daily candle after the breakout which is generally not the best breakout continuation signal. The following candle was almost a doji with a slightly larger body, but nothing too impressive. So where did all those bulls go from the big breakout bar? (See chart below).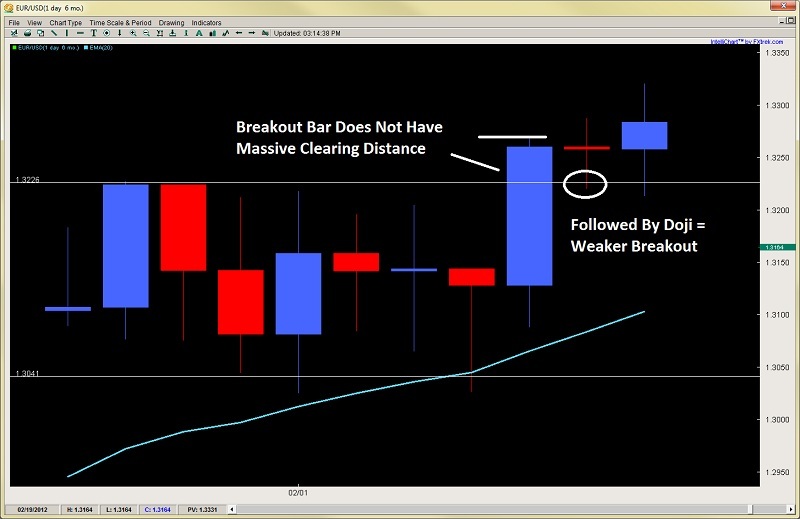 Price action then sold off to close last week suggesting the breakout bar was actually an exhaustion bar and there was nothing left in this upmove. With the Greek tragedy coming to a temporary conclusion this weekend via austerity measures (read kicking the can down the road into a cul-de-sac), one would think this would be bullish EUR vs. the USD.
Today I think was the kicker with the inverted pinbar also being an inside bar (see chart below).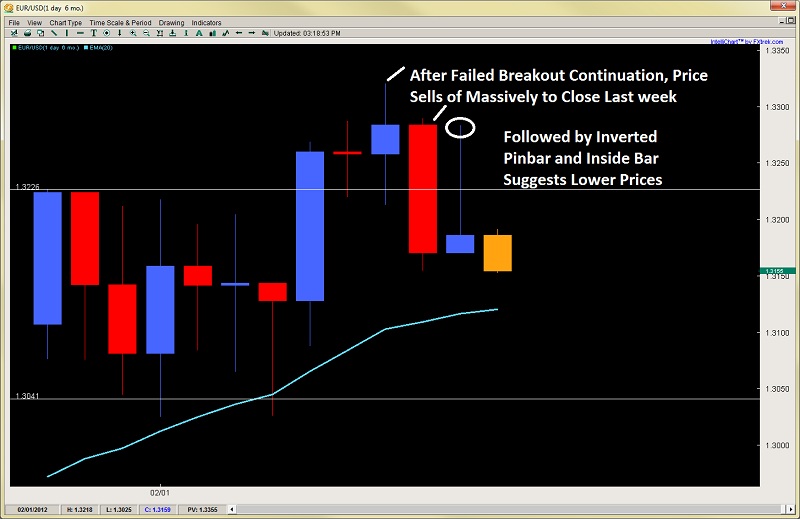 Generally with such a strong down bar from friday, being followed by a combination inverted pinbar / inside bar for Monday’s close, and pulling back into the prior range/consolidation, i’m expecting this to break Friday’s lows, minimally touch the daily 20ema where it may run into some buyers. But should this fail to hold, then we will likely see a move back to 1.3041 and the first daily close below the 20ema since Jan. 18th.
Brave or hardy bulls can look for price action triggers off the 20ema, but ask yourself if you really feel inspired to buy in the middle of a prior range which price just broke out of only to pull back into. Bears on the other hand can wait for a LH (lower high) to short near the 1.3280/3300 barrier with stops above the recent SH (swing highs) which would definitely confirm minimally a consolidation since the bulls cannot take out the prior highs and thus a likely balance between both sides with neither having massive control. This would naturally lend to a pullback to the 20ema and aforementioned 1.3041 range lows.
AUD/USD – Short Term Suggests Pullback to Key Level
After maintaining an impressive run to start the year having every daily close above the 20ema (32 in total) and climbing almost 800pips off the yearly lows, the AUD/USD closed last week with its largest open to close loss for the entire year after two prior bear closes. This likely caused some profit taking in the medium and longer term bulls part of this impressive run.
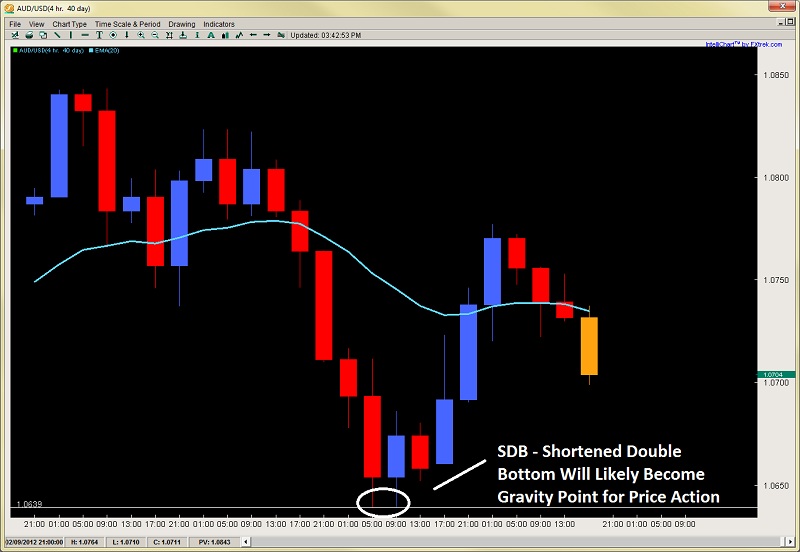
What we should be looking at is the last 4 daily candles (see chart below), which are bear doji, almost bear doji but 2nd bear close, followed by strong bear close, and yesterday being a bull close but an inside bar with a rejection near the prior daily high. The back to back doji-like closes were nothing, but the strong bear close to end last week definitely was the bears communicating they had more confidence and came in with greater force. The temporary bullish EURO news hurt the USD and helped AUD climb yesterday, but the rejection at the prior daily highs might be a tell-tale sign the bears are still out there willing to sell higher prices.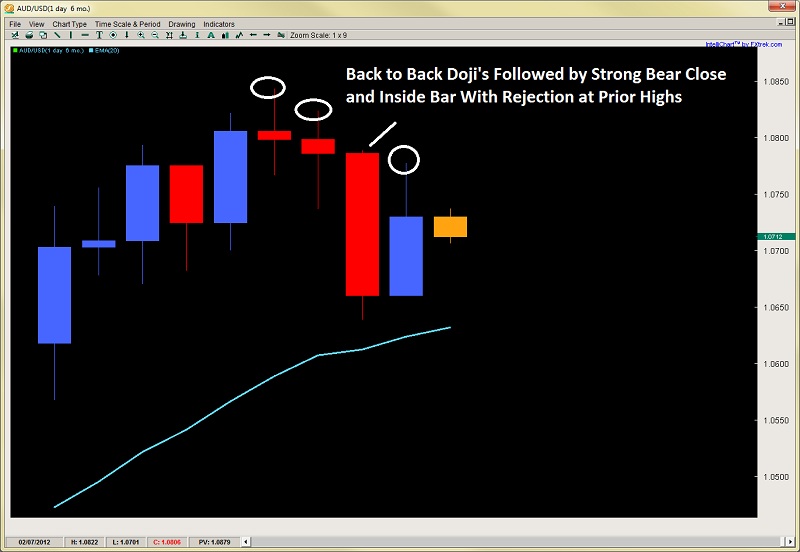 With that being said, price has closed in the middle of friday’s close and also in the middle of the inside bar (not the best location for a directional play). Drilling down to the 4hr chart below, we can see the impulsive price action selling from friday with the 5 consecutive bear candles, followed by a SDB (shortened double bottom) at 1.0639. The fact that the bottom for both those candles were rejection lows off the exact same level communicates this will likely be a gravity point for prices to fall to in the near term.
 What is also interesting to note is how on the 1hr we can see this same SDB (shortened double bottom) pattern on back to back candles. Considering the same pattern was spotted on the 4hr formation, one would expect these bottoms to be a little more spread out on a lower time compression like the 1hr. However, they were back to back so the turn-around was quite rapid. Notice the pinbar as the 2nd candle in this SDB formation which then produced a HL (Higher Low) that started the impressive 130+pip run up.
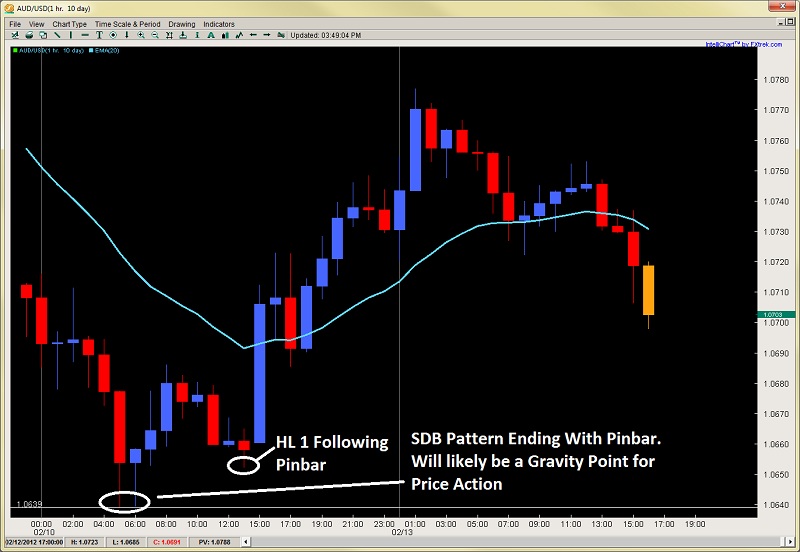 With that being said, 1.0639 is clearly a gravity point so should price fall and you already be short, we expect prices to reach this level or just shy of it (perhaps prior HL point 1). Should this gravity point be broken with vigor, then we could see a strong unwinding of the pair below 1.0600.
- English (UK)
- English (India)
- English (Canada)
- English (Australia)
- English (South Africa)
- English (Philippines)
- English (Nigeria)
- Deutsch
- Español (España)
- Español (México)
- Français
- Italiano
- Nederlands
- Português (Portugal)
- Polski
- Português (Brasil)
- Русский
- Türkçe
- العربية
- Ελληνικά
- Svenska
- Suomi
- עברית
- 日本語
- 한국어
- 简体中文
- 繁體中文
- Bahasa Indonesia
- Bahasa Melayu
- ไทย
- Tiếng Việt
- हिंदी
EUR/USD: Something Quite Peculiar
Published 02/14/2012, 02:05 AM
Updated 05/14/2017, 06:45 AM
EUR/USD: Something Quite Peculiar
Latest comments
Loading next article…
Install Our App
Risk Disclosure: Trading in financial instruments and/or cryptocurrencies involves high risks including the risk of losing some, or all, of your investment amount, and may not be suitable for all investors. Prices of cryptocurrencies are extremely volatile and may be affected by external factors such as financial, regulatory or political events. Trading on margin increases the financial risks.
Before deciding to trade in financial instrument or cryptocurrencies you should be fully informed of the risks and costs associated with trading the financial markets, carefully consider your investment objectives, level of experience, and risk appetite, and seek professional advice where needed.
Fusion Media would like to remind you that the data contained in this website is not necessarily real-time nor accurate. The data and prices on the website are not necessarily provided by any market or exchange, but may be provided by market makers, and so prices may not be accurate and may differ from the actual price at any given market, meaning prices are indicative and not appropriate for trading purposes. Fusion Media and any provider of the data contained in this website will not accept liability for any loss or damage as a result of your trading, or your reliance on the information contained within this website.
It is prohibited to use, store, reproduce, display, modify, transmit or distribute the data contained in this website without the explicit prior written permission of Fusion Media and/or the data provider. All intellectual property rights are reserved by the providers and/or the exchange providing the data contained in this website.
Fusion Media may be compensated by the advertisers that appear on the website, based on your interaction with the advertisements or advertisers.
© 2007-2025 - Fusion Media Limited. All Rights Reserved.
