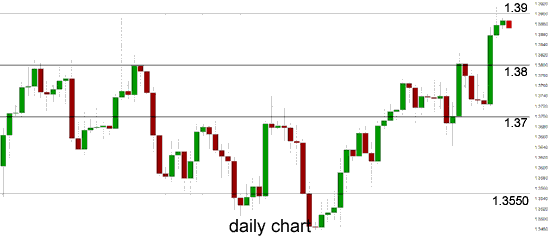
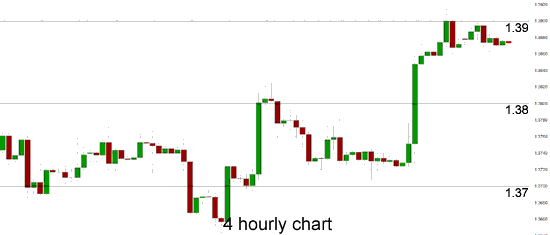
In the last few days the euro has surged up higher through the long term resistance level at 1.38 and through 1.39 to reach a new two year high, however over the last couple of days to start this week it has remained quite steady just below this level. After recently falling sharply through the key 1.37 level and reaching a two week low in the process, the euro finished out a couple of weeks ago surging higher to just above 1.38. It was however quickly rejected at that level and forced back down below 1.38. Throughout the first half of February the euro enjoyed a solid move higher moving from support around 1.35 up to test the key level at 1.37. It was able to move through the 1.37 level before consolidating and spending the best part of the last couple of weeks resting on support at that level. To finish out January the euro continued its decline and moved to a two month low touching below the support level at 1.35.
For the last couple of months the euro has generally steadied and established a trading range roughly between 1.3550 and the recent resistance level at 1.38, however to finish out several weeks ago the euro broke down through the support level at 1.3550. The 1.3550 level has become a key level over recent times and a couple of weeks ago the euro sprung off it to a two week high at the resistance level at 1.37 where it has spent several days consolidating before dropping sharply back to the key 1.3550 level again. After placing some pressure on the resistance level at 1.38 several weeks ago, the euro has since fallen sharply down to its lowest level in two months. Through November the euro enjoyed a solid move higher which saw it return to a wall of resistance at 1.38 and in doing so move to a then six week high. In the few days afterwards the euro challenged the 1.38 resistance level again before being turned away yet again. In mid November the euro did well to bounce strongly off support at 1.34 and recover the lost ground from the previous couple of days which saw it fall from the resistance level around 1.3550. This was after a few weeks which saw it move steadily higher from a support level at 1.33 back up to a three week high just above 1.3550. Over the last few months 1.3550 has been a key level.
Towards the end of October the euro enjoyed a strong surge higher to move through to its highest level in nearly two years just above 1.38 before spending that week content to consolidate around this level. Over the following three weeks it fell heavily down to a support level at 1.33 before recovering well. It moved quite well throughout the middle of October after breaking higher from its sideways range. For the month leading up to that, the euro traded within a narrow range between 1.3450 and 1.3650 before the range narrowed down to between 1.35 and 1.36. The former level of 1.35 was strongly tested a few weeks ago and has resurfaced as a significant level presently.
Mario Draghi and his crew at the ECB helped the euro shoot up on Thursday, but this time it was due to a lack of action by the central bank, rather than a change in monetary policy or any dramatic comments by Draghi. There had been speculation that the ECB might lower deposit rates into negative territory or even commence a mini-QE scheme. In the end, the Bank held the course, with Draghi reiterating his well-worn script that the ECB's high degree of accommodative monetary policy would continue for as long as needed. He also noted that the eurozone economy was recovering at a moderate pace, and shrugged concerns about inflation levels well below the ECB's target of 2%. Draghi may be able to point to encouraging data out of Germany to bolster his case that the region is headed in the right direction, but the data from other major economies, such as France and Italy, raise questions about the health of the eurozone.
 EUR/USD Daily Chart" title="EUR/USD Daily Chart" width="474" height="237">
  EUR/USD 4 Hourly Chart" title="EUR/USD 4 Hourly Chart" width="474" height="235">
EUR/USD March 11 at 01:15 GMT 1.3872 H:1.3898 L: 1.3861
EUR/USD Technical
| S3 | S2 | S1 | R1 | R2 | R3 |
| 1.3700 | 1.3500 | 1.3400 | 1.3900 | --- | --- |
During the early hours of the Asian trading session on Tuesday, the euro is remaining very steady just below the resistance level at 1.39 around 1.3870. Current range: just below 1.39 around 1.3870.
Further levels in both directions:
• Below: 1.3700, 1.3500 and 1.3400.
• Above: 1.3900.
OANDA's Open Position Ratios
(Shows the ratio of long vs. short positions held for the EUR/USD among all OANDA clients. The left percentage (blue) shows long positions; the right percentage (orange) shows short positions.)
The EUR/USD long position ratio has moved back above 20% as the euro has started to ease back from 1.39. The trader sentiment remains heavily in favour of short positions.
Economic Releases
- 00:01 UK BRC Retail Sales Monitor (Feb)
- 00:30 AU NAB Business Conditions (Feb)
- 00:30 AU NAB Business Confidence (Feb)
- 09:30 UK Industrial Production (Jan)
- 09:30 UK Manufacturing Production (Jan)
- 14:00 US Wholesale Inventories (Jan)
- JP BoJ MPC - Overnight Rate (Mar)
