The last 48 hours now has seen the Euro experience a wild ride surging higher to the resistance level at 1.30 before falling sharply back down towards the long term support level at 1.28, only to be followed by another surge higher back above 1.29. This followed a couple of days where the Euro was able to finally show some resilience and rally higher to regain some lost ground moving back to above 1.29. Over the last week or so it has fallen considerably from above 1.30 down to six week lows near 1.28. Back at the beginning of April the Euro received solid support around 1.28 and this level has been called upon over the last week, especially in the last few hours to provide additional support. Late last week it has ever so slightly traded below 1.2800 and these levels represent the lowest levels it has traded to since early April. It has also become evident over the last few days, especially on the 4 hourly chart below, that the 1.30 and 1.29 levels are now providing some resistance and placing pressure on price, although the 1.29 level has been cleared in the last 48 hours.
Over the last month the 1.32 level has become quite significant and has been an obstacle to the Euro moving higher (evident in the right half of the daily chart below). During this time, it has had some periods of little movement followed by sharp bursts. A few weeks ago, the Euro exhibited a classic pin bar reversal candlestick pattern which was indicating the significant selling pressure it experienced at any price above the 1.32 level and likely lower prices to follow. This reinforced the significance of the 1.32 level and how it was going to take considerable effort to move through there. On this pin bar, it moved to near 1.325 and to its highest level in more than two months, since the end of February when it was falling heavily from up near 1.34. Just as quickly, it has fallen away and now moved down to the six week low below 1.28. Prior to that, it was quiet and spent the most part of two weeks ago trading within a narrow range between 1.30 and 1.31, which reinforced how significant this two cent range was. In the middle of April the Euro surged up towards 1.32 and ran into a wall of resistance at that level, to then be followed by a sharp fall back towards the then support level at 1.30.
Over the last month the Euro has done well to weather the storm through February and March which saw it fall sharply from around 1.37, although its decline over the last few weeks may be reversing this good fortune. Despite its strong rally in the first half of April, it was only a few weeks ago that the Euro dropped to its lowest level since the middle of November around 1.2750, so it did very well of late to move back strongly above 1.30, despite its recent lapse. The Euro has spent the best part of the last month consolidating above the key 1.30 and 1.29 levels after its decline throughout February. Over the last couple of weeks, the 1.30 level has been called upon again to prop up price, although it may have reversed roles now as it is providing some resistance to movement higher. Sentiment has completely changed with the Euro and the last couple of months has seen a rollercoaster ride for the Euro as it continued to move strongly towards levels not seen in over 12 months above 1.37 before falling very sharply to below 1.28 and setting a 14 week low a month ago.
If the Eurozone is to get back on its feet, Germany, the largest economy in the Eurozone and the “locomotive of Europe”, will have to lead the way. However, the German locomotive is having all sorts of trouble. Last week’s GDP and inflation numbers were weak, and Thursday’s German PMIs were mixed, as Manufacturing PMI beat the estimate, while Services PMI missed the forecast. Both releases were under the 50-point level, indicating contraction in both the manufacturing and service sectors. Weak numbers out of Germany and the Eurozone continue to weigh on the shaky euro, which has coughed up about three cents in May.
EUR/USD May 24 at 01:15 GMT 1.2921 H: 1.2956 L: 1.2821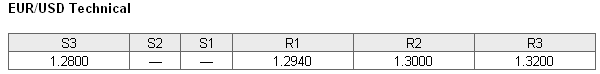 EUR/USD Technical" title="EUR/USD Technical" width="600" height="74">
During the early hours of the Asian trading session on Friday, the Euro is easing a little lower down towards 1.2920 after surging higher through 1.29 within the last 12 hours. Since the start of February, it has fallen sharply from new highs above 1.37, although it has experienced some strong rallies in that time trying to claw back lost ground. Current range: trading right around 1.2920.
Further levels in both directions:
• Below: 1.2800.
• Above: 1.2940, 1.3000, and 1.32000
(Shows the ratio of long vs. short positions held for the EUR/USD among all OANDA clients. The left percentage (blue) shows long positions; the right percentage (orange) shows short positions.)
The EUR/USD long position ratio has moved lower as the Euro has rallied a little to over 1.29. The trader sentiment shifts to in favour of short positions.
Economic Releases
- 08:30 UK BBA Mortgage Approvals (Apr)
- 12:30 US Durable goods orders (Apr)