GROWTHACES.COM Forex Trading Strategies:
Trading Positions
EUR/USD: long at 1.1820, target 1.2020, stop-loss 1.1790
USD/CHF: short at 1.0160, target 0.9990, stop-loss 1.0190
USD/JPY: long at 118.70, target 121.80, stop-loss 117.80
EUR/GBP: short at 0.7850, target 0.7700, stop-loss 0.7880
EUR/CHF: long at 1.2025, target 1.2090, stop-loss 1.1995
AUD/NZD: short at 1.0530, target 1.0320, stop-loss 1.0475
Pending Orders
USD/CAD: buy at 1.1700, if filled target 1.1990, stop-loss 1.1630
We encourage you to visit our website and subscribe to our newsletter to receive daily forex analysis and trading strategies summary.
EUR/USD: How Will The ECB React To Deflation?
(long for 1.2020)
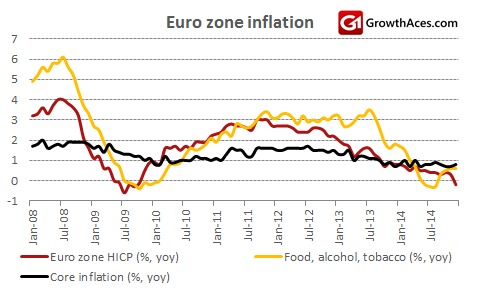
- Eurozone December headline inflation fell more than expected. HICP inflation amounted to -0.2% YOY in December, down from 0.3% YOY in November. The median forecast was at the level of -0.1% YOY. However, the core rate excluding energy, food, alcohol and tobacco moved higher to 0.8% YOY compared to 0.7% YOY. The data show that deflation is the result of much cheaper energy. Energy prices fell by 6.3% YOY vs. a decline by -2.6% YOY in November.

- Why was the inflation reading so important today and what does it mean for the nearest decision of the European Central Bank?
- The ECB is expected to announce the full-blown quantitative easing on January 22. However, the ECB may say that deflation is only the result of low crude prices and result mainly from supply-side factors and core inflation is still positive. The deflation based on a slump in oil prices may increase may increase the purchasing power of consumers. The ECB may also say that low oil prices will reduce businesses’ costs and could be supportive for higher economic activity in the future. Moreover, a strong depreciation of the EUR since last ECB meeting gives a strong boost to the exporters from the eurozone. That is why, the decision on quantitative easing may be postponed. The ECB may choose to wait and see if the economic growth strengthens before deciding on sovereign QE.
- On the other hand, the European Central Bank will have to counteract rising deflationary expectations. A more sustained period of deflation may destroy debt consolidation efforts of the eurozone countries. A deflation creates a risk that asset prices also fall, particularly property and other assets used as collateral, which would be negative for heavily-indebted economies of the eurozone.
- Tuesday brought important data from U.S. economy. ISM index in the services sector fell to 56.2 in December, compared with 59.3 in November. The reading fell short of the consensus for a 58 reading.
- U.S. New orders for manufactured goods dropped 0.7% mom in November after an unrevised 0.7% mom fall in October. A decline by 0.5% mom was expected. Factory orders excluding the volatile transportation category fell 0.6% mom as demand declined almost across the board. That followed a 1.5% mom drop in October. Inventories rose 0.1% mom in November, while shipments fell 0.6% mom. The inventories-to-shipments ratio was 1.32, unchanged from October.
- We have one more important event scheduled for today – FOMC minutes (19:00 GMT), which in our opinion may be not so hawkish, as it is widely expected. That would support the EUR/USD in the short term. Moreover, investors will be focused on ADP employment change (13:15 GMT) – an important reading ahead of Friday’s U.S. jobs report.
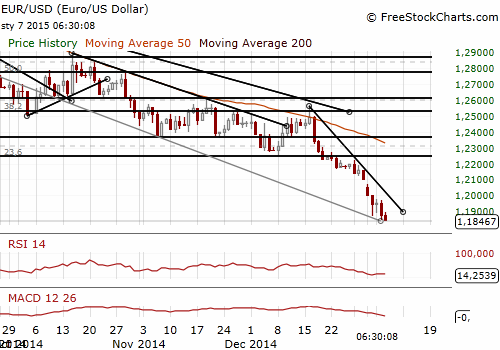
- Our EUR/USD reached its stop-loss level at 1.1875 yesterday . Our EUR/USD trading strategy for today is to get long ahead of FOMC minutes that in our opinion are likely to provide some relief to the EUR. We’ve got long at 1.1820 with the target at 1.2020 and stop-loss at 1.1790.
 Significant technical analysis' levels:
Resistance: 1.1892 (hourly high Jan 7), 1.1969 (hourly high Jan 6), 1.2006 (high Jan 5)
Support: 1.1800 (low January, 2006), 1.1640 (low November, 2005), 1.1212 (61.8% of 0.8228-1.6040)
USD/CAD Hit Fresh Multi-year High
(looking to get long again)
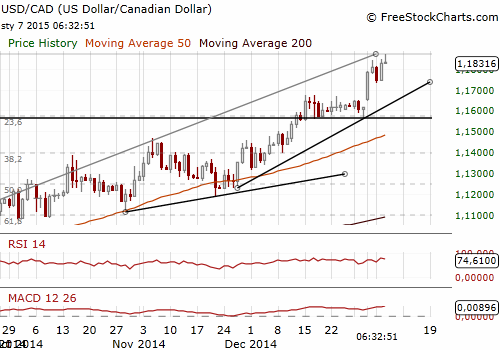
- The USD/CAD rose to its highest since May 2009 yesterday. The CAD was undercut by crude prices that were beaten down and closed at 47.93 USD a barrel on Tuesday. The loonie was also underperforming most other major currencies. Canada is a major oil exporter and its currency is strongly correlated with crude prices – we encourage you to check our Correlation Matrix that will be released later today.
- The CAD traders are waiting for Canada's trade balance for November (today 13:30 GMT) and Canadian and U.S. jobs data for December (Friday 13:30 GMT). After taking profit on our long USD/CAD position on Friday, our forex trading strategy for the USD/CAD is to get long again on dips. The next target will be 1.1990. We raised our buy order to 1.1700.

Significant technical analysis' levels:
Resistance: 1.1867 (hourly high, Jan 7), 1.1900 (psychological level), 1.1951 (May 1, 2009)
Support: 1.1732 (low Jan 6), 1.1600 (low Jan 2), 1.1567 (low Dec 31, 2014)
