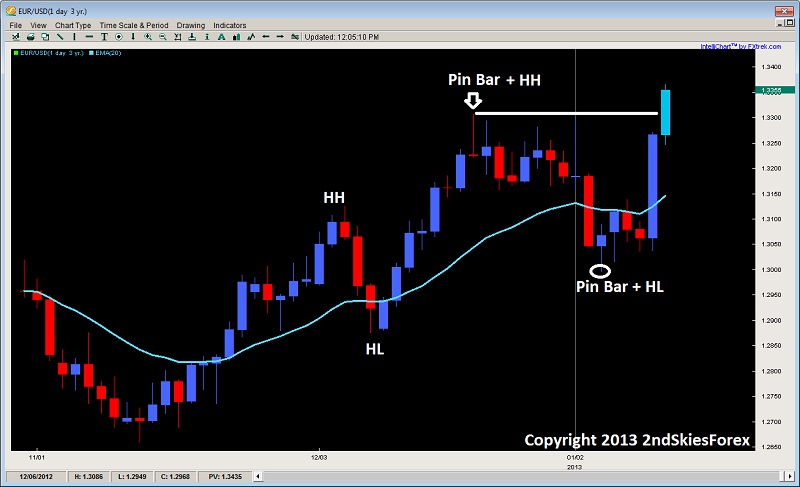
Keeping with the general daily uptrend, there is a moment of truth coming up for the euro bulls. After clearing the recent resistance and pin bar high at 1.3300, the pair is heading into two key resistance levels which should really test the bulls. First up is the nearby 1.3387 which was a major swing high from March of last year, and then the 1.3489 which is the yearly high for 2012. My guess is there will be a fair amount of bears parked at those levels which offers a few plays.
Bears who want to sell the pair can look at the 2012 highs and intraday price action reversal signals, while bulls can wait for a breakout pullback setup – for if there are a fair amount of bears at this level, then their stops are likely above, and once tripped, should offer a strong move further after clearing the big figure at 1.3500. But for now, the series of HL’s (higher lows) and HH’s (higher highs) are communicating the bulls have short term control of the pair.
EUR/JPY
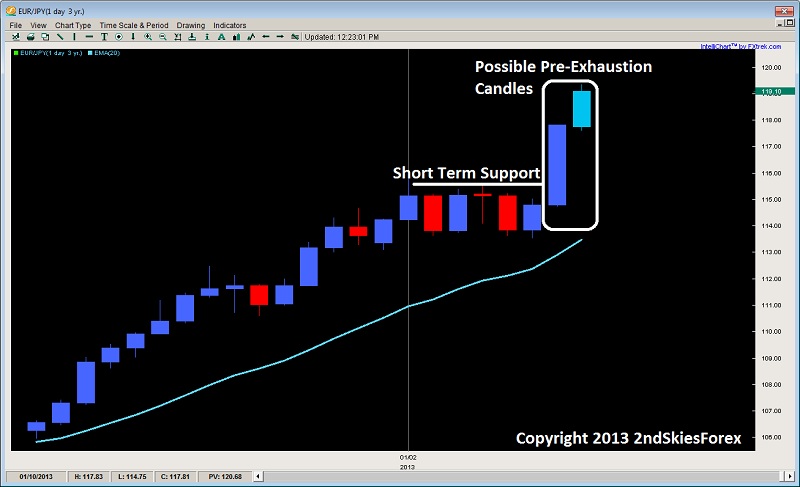
Part of the euro’s success vs. the USD has been in its companion EUR/JPY pair which has gone ballistic taking no prisoners. The pair is approaching the big figure at 120.00, but after that we do not encounter multi-year resistance until 121.84 and 123.33 which are the April 2011 swing highs and 2011 yearly highs respectively. From a quantitative price action perspective, we are in extreme territory for the pair as prior to friday’s close, we had never had more than 38 consecutive candle closes above the 20ema without having a touch on the 20ema and dynamic support.
The pair has not shown any exhaustion price action candles yet, but the key word is yet, so I’ll be looking to possibly short the pair soon. However, short-term – buying on breaks is not my favorite as I do not want to chase this trend, so will wait for corrective pullbacks before considering getting long. 
Dow Jones Index
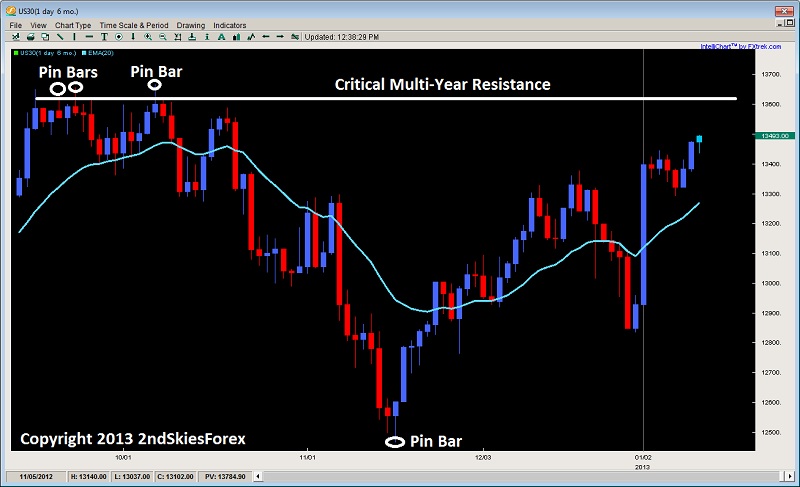
Also enjoying the risk on lift-a-thon as of late, the Dow Jones has started 2013 off with a bang, gaining 5 of 8 trading days this year. The major index is now approaching multi-year resistance at the 13663 level, which also was a triple top forming dual pin bars at the level.
My suspicion is there are likely option players and sellers waiting to defend this level, so watch for intraday price action signals at this level for possible shorts. Any break and daily close above this level could offer a chance for bulls to get long on a possible attack of 14000.
Crude Oil
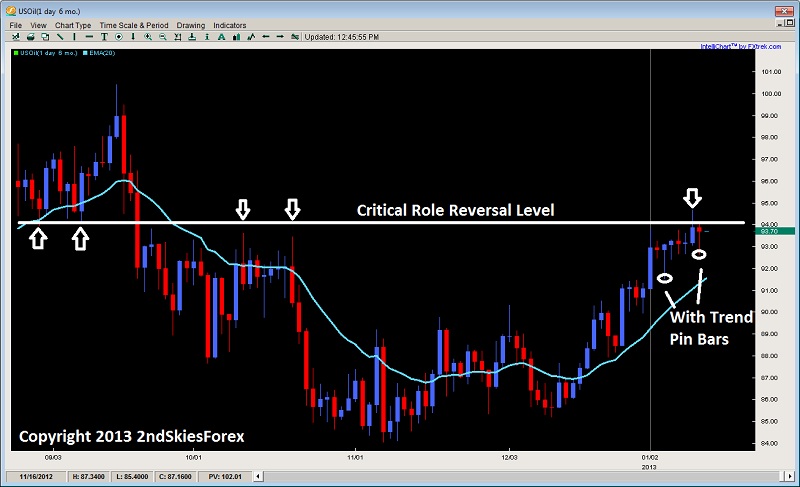
Although the medium-term trend is up, crude oil has been a little less certain as of late considering almost every single daily candle for this year has solid wicks on both sides of the market – suggesting intraday two way price action. Most of the wicks are to the downside suggesting the commodity is underpinned, along with the two bullish pin bars, but it’s definitely encountering resistance at $94.00 which is a crucial role reversal level, so really plays for both bears and bulls at this level.
I’ll be interested in corrective pullbacks towards $92.00, or a possible breakout pullback setup above $94.00 until I see a stronger response from the bears.
Original post
- English (UK)
- English (India)
- English (Canada)
- English (Australia)
- English (South Africa)
- English (Philippines)
- English (Nigeria)
- Deutsch
- Español (España)
- Español (México)
- Français
- Italiano
- Nederlands
- Português (Portugal)
- Polski
- Português (Brasil)
- Русский
- Türkçe
- العربية
- Ελληνικά
- Svenska
- Suomi
- עברית
- 日本語
- 한국어
- 简体中文
- 繁體中文
- Bahasa Indonesia
- Bahasa Melayu
- ไทย
- Tiếng Việt
- हिंदी
EUR/USD: Heading Into Key Resistance Levels
Published 01/14/2013, 02:41 AM
Updated 05/14/2017, 06:45 AM
EUR/USD: Heading Into Key Resistance Levels
EUR/USD
Latest comments
Loading next article…
Install Our App
Risk Disclosure: Trading in financial instruments and/or cryptocurrencies involves high risks including the risk of losing some, or all, of your investment amount, and may not be suitable for all investors. Prices of cryptocurrencies are extremely volatile and may be affected by external factors such as financial, regulatory or political events. Trading on margin increases the financial risks.
Before deciding to trade in financial instrument or cryptocurrencies you should be fully informed of the risks and costs associated with trading the financial markets, carefully consider your investment objectives, level of experience, and risk appetite, and seek professional advice where needed.
Fusion Media would like to remind you that the data contained in this website is not necessarily real-time nor accurate. The data and prices on the website are not necessarily provided by any market or exchange, but may be provided by market makers, and so prices may not be accurate and may differ from the actual price at any given market, meaning prices are indicative and not appropriate for trading purposes. Fusion Media and any provider of the data contained in this website will not accept liability for any loss or damage as a result of your trading, or your reliance on the information contained within this website.
It is prohibited to use, store, reproduce, display, modify, transmit or distribute the data contained in this website without the explicit prior written permission of Fusion Media and/or the data provider. All intellectual property rights are reserved by the providers and/or the exchange providing the data contained in this website.
Fusion Media may be compensated by the advertisers that appear on the website, based on your interaction with the advertisements or advertisers.
© 2007-2025 - Fusion Media Limited. All Rights Reserved.
