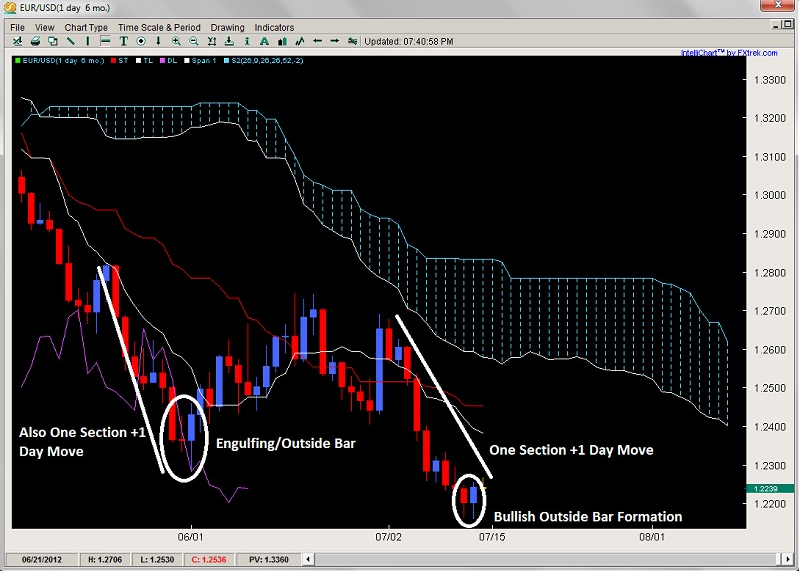
After starting last week with a daily Tenkan-Kijun cross last week, the pair formed a bullish outside bar after a one section and one day move (using Ichimoku number theory) which we had talked about last week in our forex market commentary. The last time it formed a bullish outside bar on the daily charts ironically was after a one section and one day move, and formed a bounce.
Although the Tenkan is down, the Kijun is flat and I am expecting a modest bounce either to 1.2281 or 1.2400 before the downtrend will resume. Thus, even though the euro has been selling off every 2 of its last 3 days for some time, I’ll favor a pullback before selling at the aforementioned levels instead of taking a short on a break.
USD/CAD
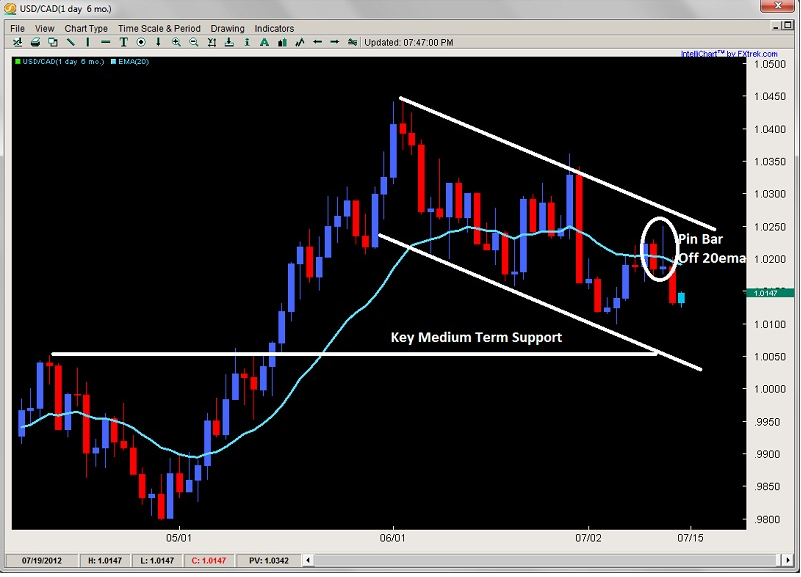
After trending strongly for the month of may, the loonie has been in a volatile corrective pullback for the last 45 days, selling off exactly 1 out of every 2 days. With the selling days being equal to the buying, yet losing ground, the bears are clearly in control. But I have to confess the structured nature of the pullback (being exactly even in selling/buying days) along with the channel are pointing to more retracement style pullback instead of a full blown reversal of the trend. This leads me to believe a continuation of the may uptrend is more likely.
However, analysis of the channel suggests that if it breaks down further and touches the channel bottom before hitting the channel top, then the bears could be wrestling control from the bulls and look to take out key support at 1.0051. Bulls can take longs on the channel bottom or towards the 1.0051 support level while bears can look at selling around the channel top around 1.0275 which is near the pin bar high.
AUD/USD
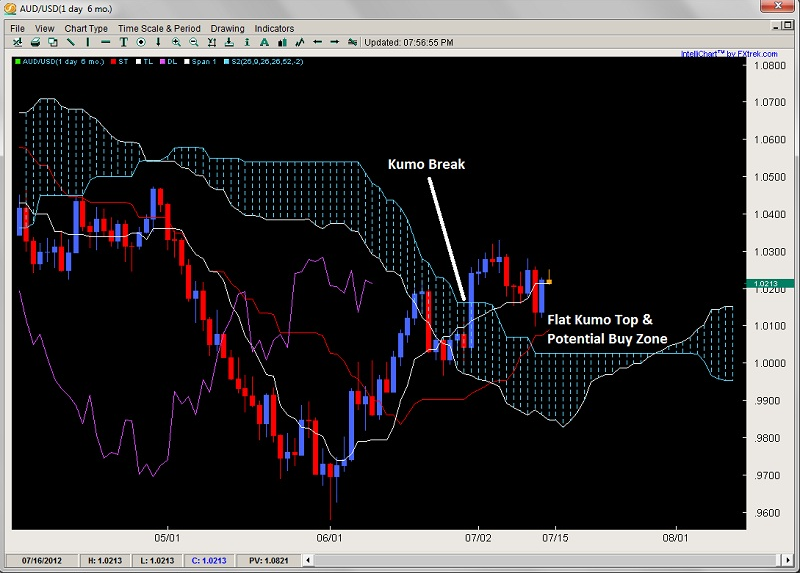
While many of the majors are struggling vs. the USD, the aussie has been making some headway and is potentially staging a medium-term reversal. From an Ichimoku perspective, it has all the ingredients with the prior Kumo break, Tenkan and Kijun clearing the cloud as well. Now it just needs the chikou to clear the Kumo and the Ichimoku picture will be strongly bullish. I wrote last week how I suspected a pullback was likely and that is how it played out. I’m interested in longs near the flat Kumo around parity which may happen in the middle of this week. Bears can look to sell at last weeks high around 1.0350 which might form a Chikou rejection around the Senkou span A.
Oil
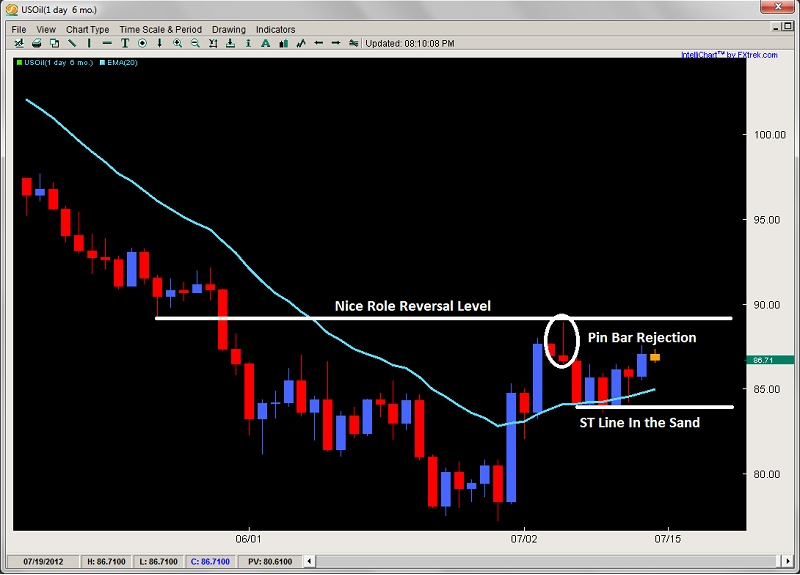
After forming opposite pin bars in back to back weeks, oil is offering plays for both bulls and bears on a short-term basis so we are going to map out both sides. For bears, there is a nice role reversal level coming up right around $89 which was a pin bar rejection from two weeks ago so a potential intraday setup there. Bulls on the other hand have a nice intraday base to take longs with tight stops at last weeks line in the sand which is right around $83.84 as the commodity is potentially forming a HL (higher low) and thus a base for a medium-term reversal so potential for bulls here as well.
- English (UK)
- English (India)
- English (Canada)
- English (Australia)
- English (South Africa)
- English (Philippines)
- English (Nigeria)
- Deutsch
- Español (España)
- Español (México)
- Français
- Italiano
- Nederlands
- Polski
- Português (Portugal)
- Português (Brasil)
- Русский
- Türkçe
- العربية
- Ελληνικά
- Svenska
- Suomi
- עברית
- 日本語
- 한국어
- 简体中文
- 繁體中文
- Bahasa Indonesia
- Bahasa Melayu
- ไทย
- Tiếng Việt
- हिंदी
EUR/USD: Bullish Outside Bar
Published 07/16/2012, 04:16 AM
Updated 05/14/2017, 06:45 AM
EUR/USD: Bullish Outside Bar
EUR/USD
Latest comments
Loading next article…
Install Our App
Risk Disclosure: Trading in financial instruments and/or cryptocurrencies involves high risks including the risk of losing some, or all, of your investment amount, and may not be suitable for all investors. Prices of cryptocurrencies are extremely volatile and may be affected by external factors such as financial, regulatory or political events. Trading on margin increases the financial risks.
Before deciding to trade in financial instrument or cryptocurrencies you should be fully informed of the risks and costs associated with trading the financial markets, carefully consider your investment objectives, level of experience, and risk appetite, and seek professional advice where needed.
Fusion Media would like to remind you that the data contained in this website is not necessarily real-time nor accurate. The data and prices on the website are not necessarily provided by any market or exchange, but may be provided by market makers, and so prices may not be accurate and may differ from the actual price at any given market, meaning prices are indicative and not appropriate for trading purposes. Fusion Media and any provider of the data contained in this website will not accept liability for any loss or damage as a result of your trading, or your reliance on the information contained within this website.
It is prohibited to use, store, reproduce, display, modify, transmit or distribute the data contained in this website without the explicit prior written permission of Fusion Media and/or the data provider. All intellectual property rights are reserved by the providers and/or the exchange providing the data contained in this website.
Fusion Media may be compensated by the advertisers that appear on the website, based on your interaction with the advertisements or advertisers.
© 2007-2025 - Fusion Media Limited. All Rights Reserved.
