
The EUR/USD pair has broken its symmetrical triangle pattern on a 30 minute time frame. If this pattern does play out completely, then we could see the price near the major support zone (1.268-1.265). The price is trading below the 50 day (shown in green) and above the 100 day (shown in yellow) moving averages, which suggest not all the technical sentiment is bearish.
Volatility for the pair remains low as the price is trading within the Bollinger Band® with a standard deviation of 2. The RSI has shown a clear sign of deflection, which means bias could be towards the downside.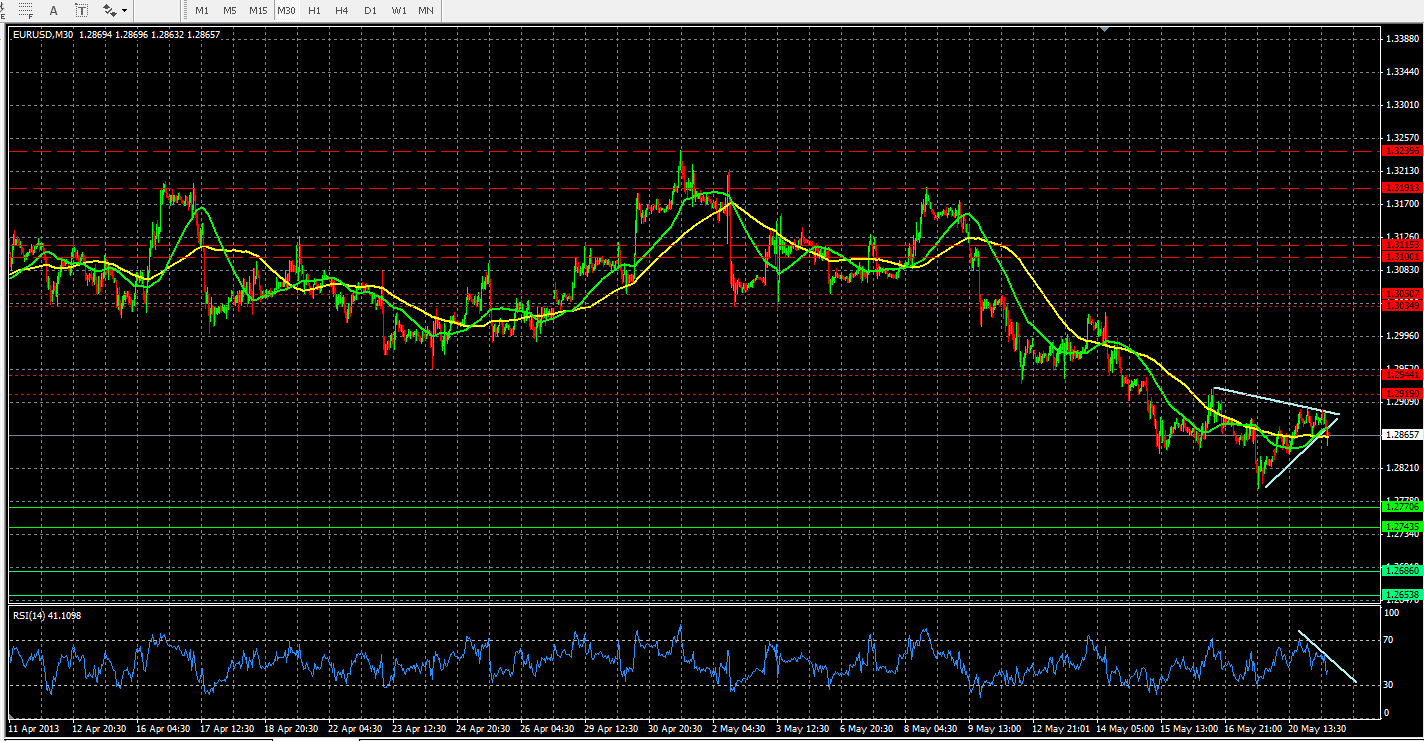 EUR/USD M30" title="EUR/USD M30" width="1424" height="741">
Important Levels
Support Zone
1.2686-1.2653 Major
1.2770-1.2743 Major
Resistance Zone
1.3239-1.3191 Major
1.3115-1.3100 Major
1.3050-1.3034 Minor
1.2644-1.2919 Minor
DISCLOSURE & DISCLAIMER:
The above is for informational purposes only and NOT to be construed as specific trading advice. responsibility for trade decisions is solely with the reader.
by Naeem Aslam
- English (UK)
- English (India)
- English (Canada)
- English (Australia)
- English (South Africa)
- English (Philippines)
- English (Nigeria)
- Deutsch
- Español (España)
- Español (México)
- Français
- Italiano
- Nederlands
- Polski
- Português (Portugal)
- Português (Brasil)
- Русский
- Türkçe
- العربية
- Ελληνικά
- Svenska
- Suomi
- עברית
- 日本語
- 한국어
- 简体中文
- 繁體中文
- Bahasa Indonesia
- Bahasa Melayu
- ไทย
- Tiếng Việt
- हिंदी
EUR/USD: Bearish Symmetrical Triangle Pattern Broken
Published 05/21/2013, 07:43 AM
Updated 02/02/2022, 05:40 AM
EUR/USD: Bearish Symmetrical Triangle Pattern Broken
Latest comments
Loading next article…
Install Our App
Risk Disclosure: Trading in financial instruments and/or cryptocurrencies involves high risks including the risk of losing some, or all, of your investment amount, and may not be suitable for all investors. Prices of cryptocurrencies are extremely volatile and may be affected by external factors such as financial, regulatory or political events. Trading on margin increases the financial risks.
Before deciding to trade in financial instrument or cryptocurrencies you should be fully informed of the risks and costs associated with trading the financial markets, carefully consider your investment objectives, level of experience, and risk appetite, and seek professional advice where needed.
Fusion Media would like to remind you that the data contained in this website is not necessarily real-time nor accurate. The data and prices on the website are not necessarily provided by any market or exchange, but may be provided by market makers, and so prices may not be accurate and may differ from the actual price at any given market, meaning prices are indicative and not appropriate for trading purposes. Fusion Media and any provider of the data contained in this website will not accept liability for any loss or damage as a result of your trading, or your reliance on the information contained within this website.
It is prohibited to use, store, reproduce, display, modify, transmit or distribute the data contained in this website without the explicit prior written permission of Fusion Media and/or the data provider. All intellectual property rights are reserved by the providers and/or the exchange providing the data contained in this website.
Fusion Media may be compensated by the advertisers that appear on the website, based on your interaction with the advertisements or advertisers.
© 2007-2024 - Fusion Media Limited. All Rights Reserved.