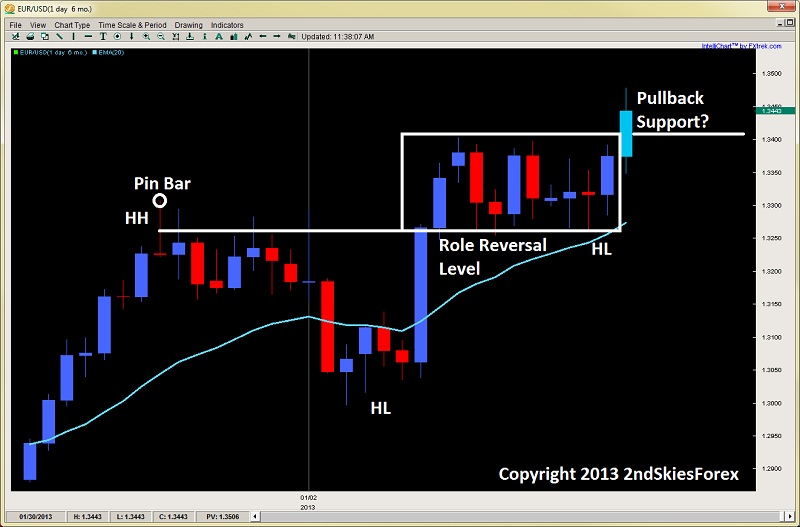
Last week in my market commentary I talked about how a) there were good price action range plays off the lows of the channel, and b) how the pair would break the range this week. Both came true as the bottom of the range held at a role reversal level, and the pair broke to the upside.
1.3400 becomes support on intraday pullbacks. If this holds, expect a challenge of 1.3500. A failure back into the range suggests the medium term trend is in danger, and a likely pullback to 1.3250.
GBP/JPY
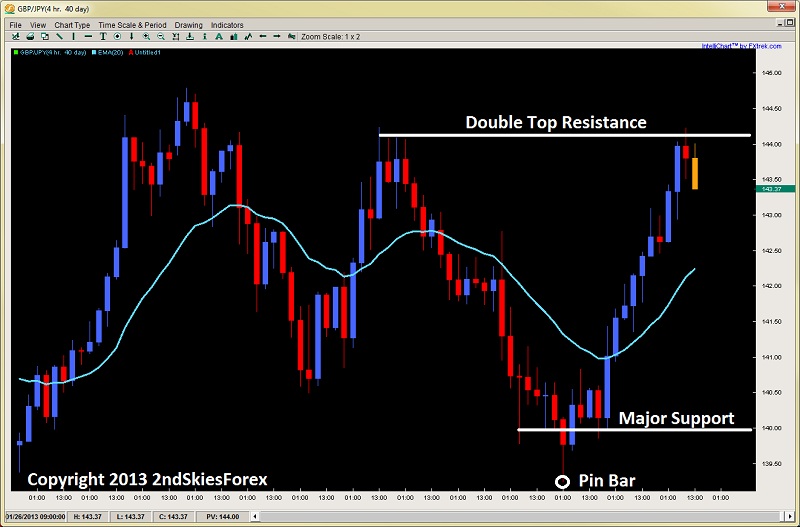
Last Thursday I wrote to look for likely price action reversal signals on the GBP/JPY around 144.00 area for likely topping of the current swing and an intraday sell signal. The pair did just that, going up to 144.23, then selling off 90 pips from the SH (swing high level). Intraday support comes in at 142.50 and 142. A break down of these suggests a deeper pullback towards 140.50. Upside resistance is still 144.23 and 144.50.
S&P 500
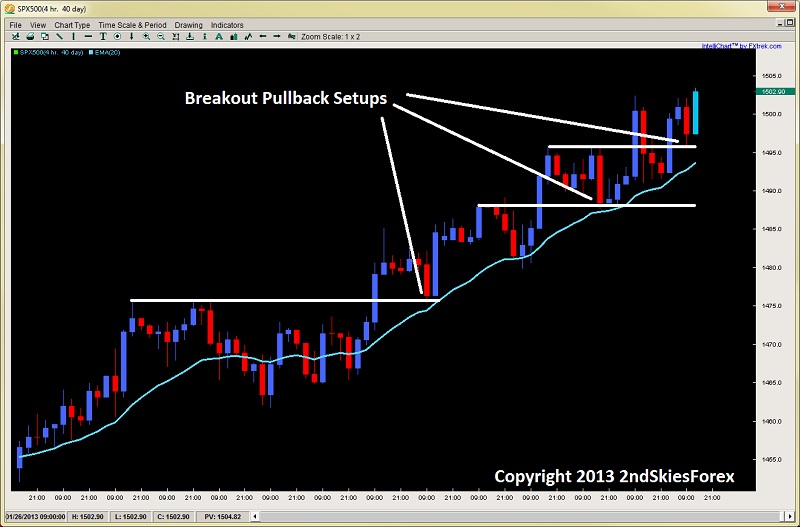
After the breakout pullback setup on Jan. 18th at the key resistance of 1475, the S&P 500 has been consistently bought up on pullbacks to the dynamic support and 20ema now 4x. The selling is getting a little more aggressive, but until this line breaks, the index will likely be supported. Even though I’m seeing some presence of a possible weakening from the current bulls, look for intraday pullbacks towards the 20ema until you see a close below it.
Gold
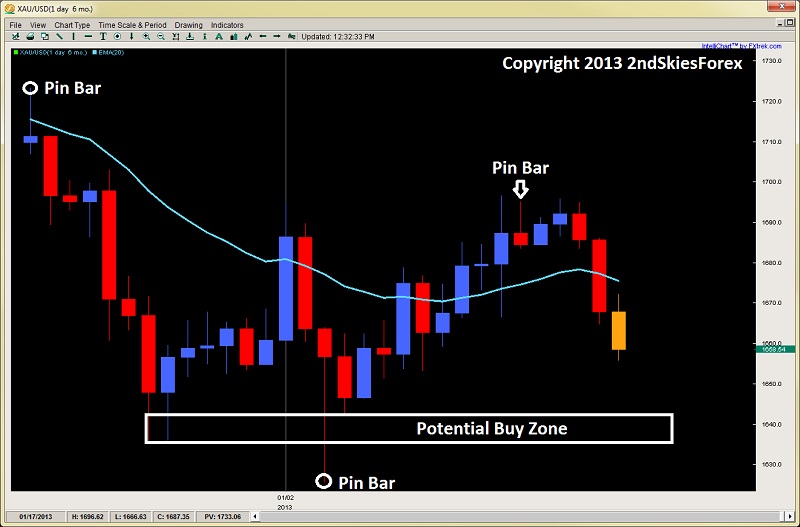
Getting hammered to end last week, the PM has taken out about 7 days of gains in a matter of 3. Although I am looking for a buy signal soon, I have not seen the price action signs yet that the selling is done. I’ll look for possible buy signals between $1645 and $1635, but if this fails, then I would not consider another buy till $1625 which is the daily pin bar low from Jan. 4th this year. Until then, I’ll look for intraday price action signals to get short.
Original post
- English (UK)
- English (India)
- English (Canada)
- English (Australia)
- English (South Africa)
- English (Philippines)
- English (Nigeria)
- Deutsch
- Español (España)
- Español (México)
- Français
- Italiano
- Nederlands
- Português (Portugal)
- Polski
- Português (Brasil)
- Русский
- Türkçe
- العربية
- Ελληνικά
- Svenska
- Suomi
- עברית
- 日本語
- 한국어
- 简体中文
- 繁體中文
- Bahasa Indonesia
- Bahasa Melayu
- ไทย
- Tiếng Việt
- हिंदी
EUR/USD: 1.3400 Becomes Support
Published 01/28/2013, 04:07 AM
Updated 05/14/2017, 06:45 AM
EUR/USD: 1.3400 Becomes Support
EUR/USD
Latest comments
Loading next article…
Install Our App
Risk Disclosure: Trading in financial instruments and/or cryptocurrencies involves high risks including the risk of losing some, or all, of your investment amount, and may not be suitable for all investors. Prices of cryptocurrencies are extremely volatile and may be affected by external factors such as financial, regulatory or political events. Trading on margin increases the financial risks.
Before deciding to trade in financial instrument or cryptocurrencies you should be fully informed of the risks and costs associated with trading the financial markets, carefully consider your investment objectives, level of experience, and risk appetite, and seek professional advice where needed.
Fusion Media would like to remind you that the data contained in this website is not necessarily real-time nor accurate. The data and prices on the website are not necessarily provided by any market or exchange, but may be provided by market makers, and so prices may not be accurate and may differ from the actual price at any given market, meaning prices are indicative and not appropriate for trading purposes. Fusion Media and any provider of the data contained in this website will not accept liability for any loss or damage as a result of your trading, or your reliance on the information contained within this website.
It is prohibited to use, store, reproduce, display, modify, transmit or distribute the data contained in this website without the explicit prior written permission of Fusion Media and/or the data provider. All intellectual property rights are reserved by the providers and/or the exchange providing the data contained in this website.
Fusion Media may be compensated by the advertisers that appear on the website, based on your interaction with the advertisements or advertisers.
© 2007-2025 - Fusion Media Limited. All Rights Reserved.
