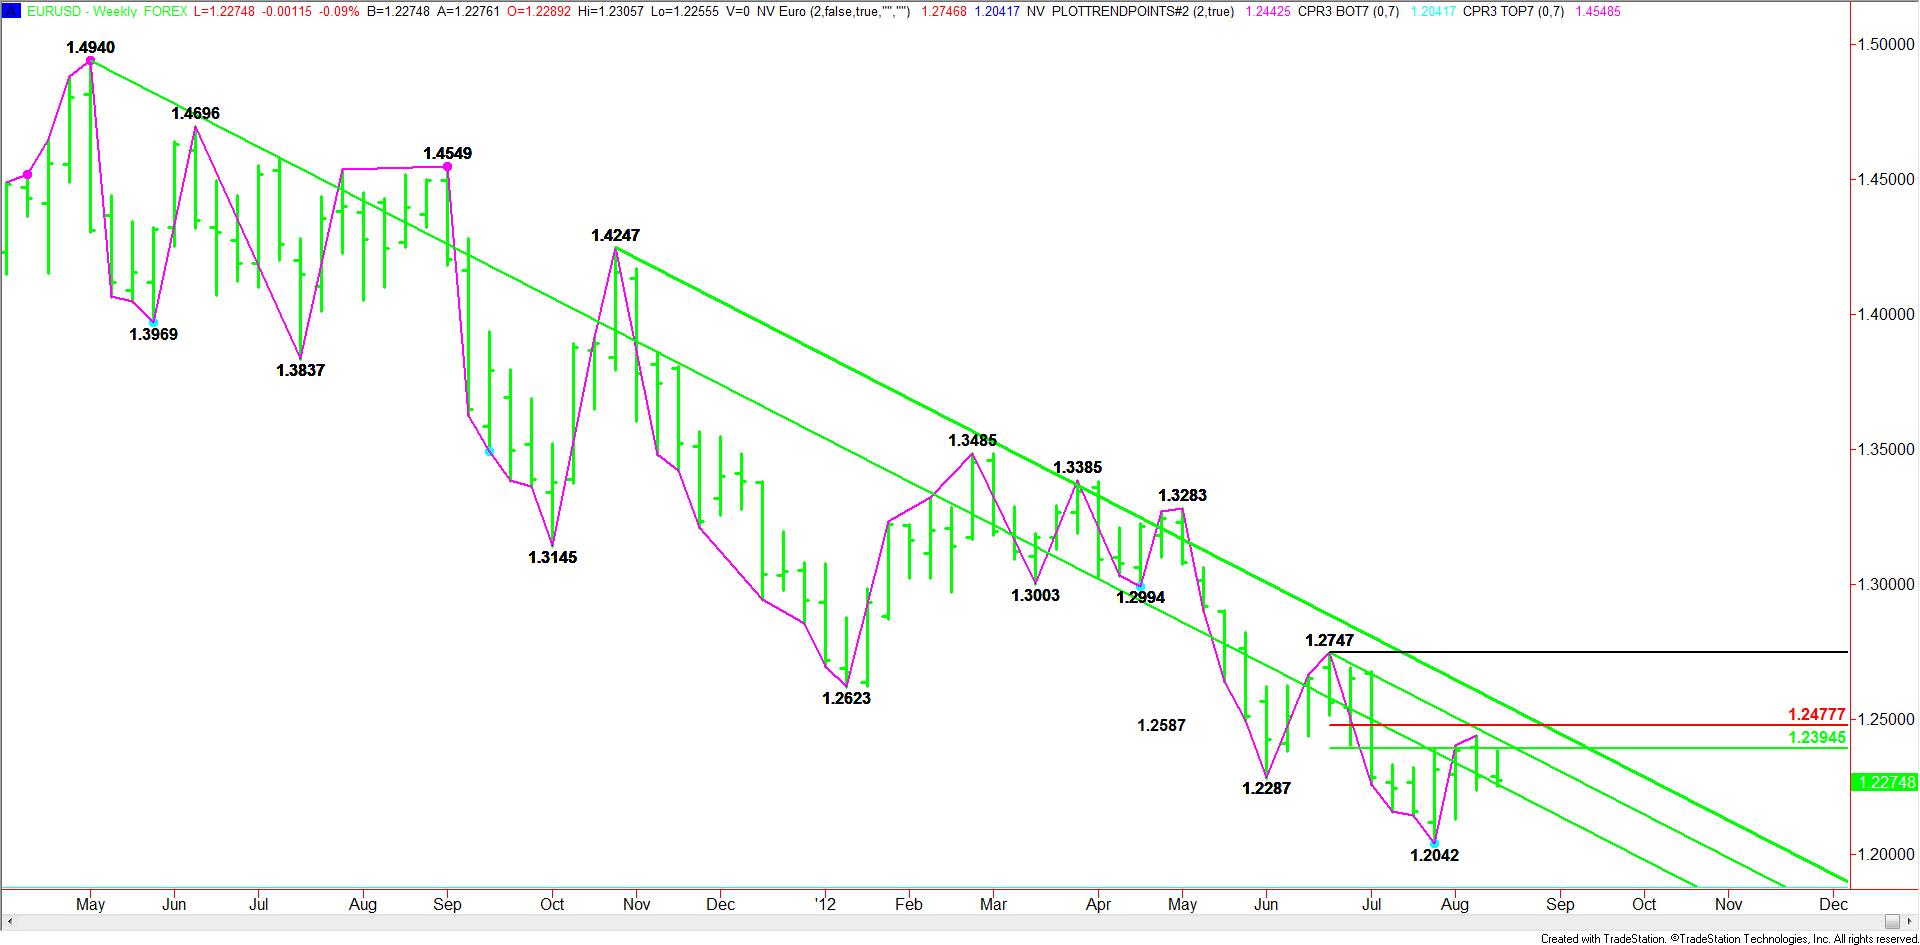
Despite the euro’s short-covering rally triggered by positive comments from European Central Bank President Mario Draghi three weeks ago, the move amounted only to a little more than 50% of the last swing down from 1.2747 to 1.2042.
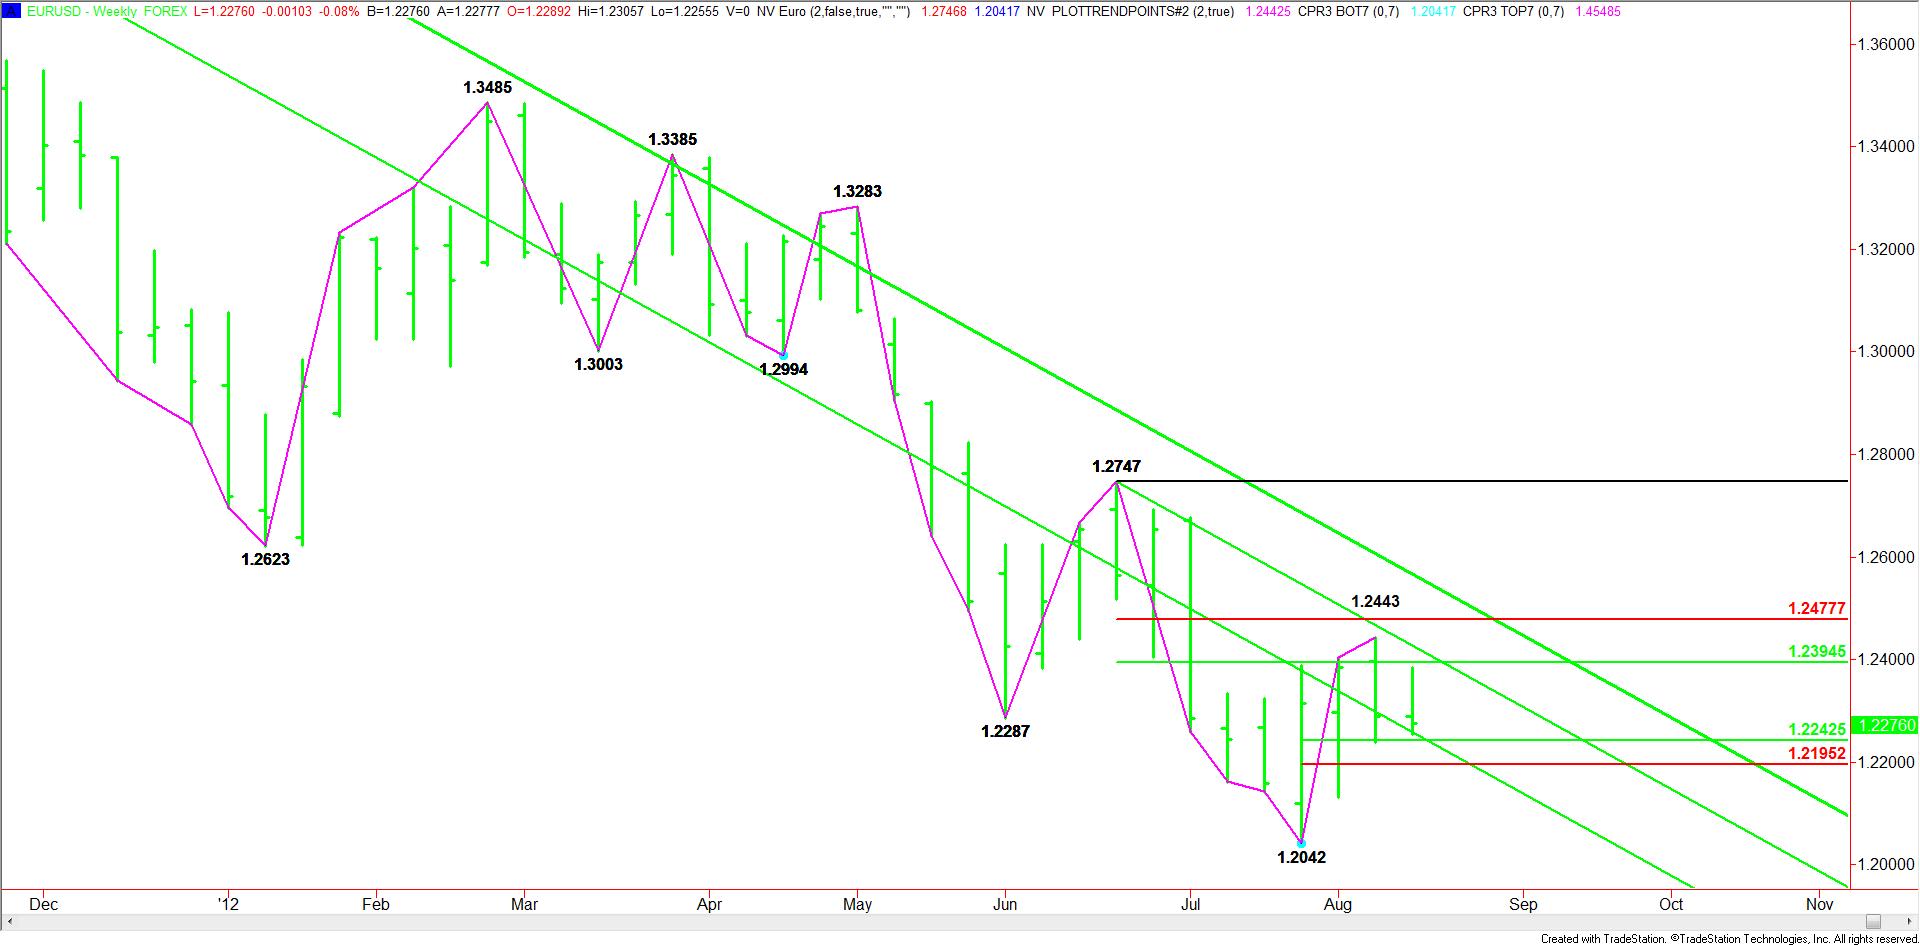
Following the weekly closing price reversal bottom at 1.2042, the EUR/USD reached a high last week at 1.2443. This high was a little more than the 50% price level at 1.2394, but short of the 61.8% retracement price at 1.2478. Nonetheless, it proved to be an attractive price for short-sellers looking to start another leg down.
 EUR/USD Pattern, Price & Time Analysis" title="Weekly EUR/USD Pattern, Price & Time Analysis" width="803" height="300" />
After crossing a long-term downtrending Gann angle from the 1.4940 top at 1.2260 this week, the rally in the euro looked promising initially. But another Gann angle from the 1.2747 top at 1.2427 the week-ending August 17 proved to be too much resistance. This week’s sell-off suggests that these angles are likely to continue to guide prices lower over the near-term.
 EUR/USD Pattern, Price & Time Analysis" title="Weekly EUR/USD Pattern, Price & Time Analysis" width="803" height="300" />
Besides the steep downtrending Gann angles, the series of lower-tops and lower-bottoms is also exerting downward pressure on the euro. The weekly swing chart clearly indicates a well-established downtrend. The current chart formation indicates the main trend will remain down until the swing top at 1.2747 is violated. Following two weeks of lower tops and lower bottoms, this main top will move down to 1.2443. A trade through 1.2042 will reaffirm the well-established downtrend.
Following the weekly closing price reversal bottom at 1.2042, the EUR/USD reached a high last week at 1.2443. This high was a little more than the 50% price level at 1.2394, but short of the 61.8% retracement price at 1.2478. Nonetheless, it proved to be an attractive price for short-sellers looking to start another leg down.
 EUR/USD Pattern, Price & Time Analysis" title="Weekly EUR/USD Pattern, Price & Time Analysis" width="803" height="300" />
After crossing a long-term downtrending Gann angle from the 1.4940 top at 1.2260 this week, the rally in the euro looked promising initially. But another Gann angle from the 1.2747 top at 1.2427 the week-ending August 17 proved to be too much resistance. This week’s sell-off suggests that these angles are likely to continue to guide prices lower over the near-term.
 EUR/USD Pattern, Price & Time Analysis" title="Weekly EUR/USD Pattern, Price & Time Analysis" width="803" height="300" />
Besides the steep downtrending Gann angles, the series of lower-tops and lower-bottoms is also exerting downward pressure on the euro. The weekly swing chart clearly indicates a well-established downtrend. The current chart formation indicates the main trend will remain down until the swing top at 1.2747 is violated. Following two weeks of lower tops and lower bottoms, this main top will move down to 1.2443. A trade through 1.2042 will reaffirm the well-established downtrend.
