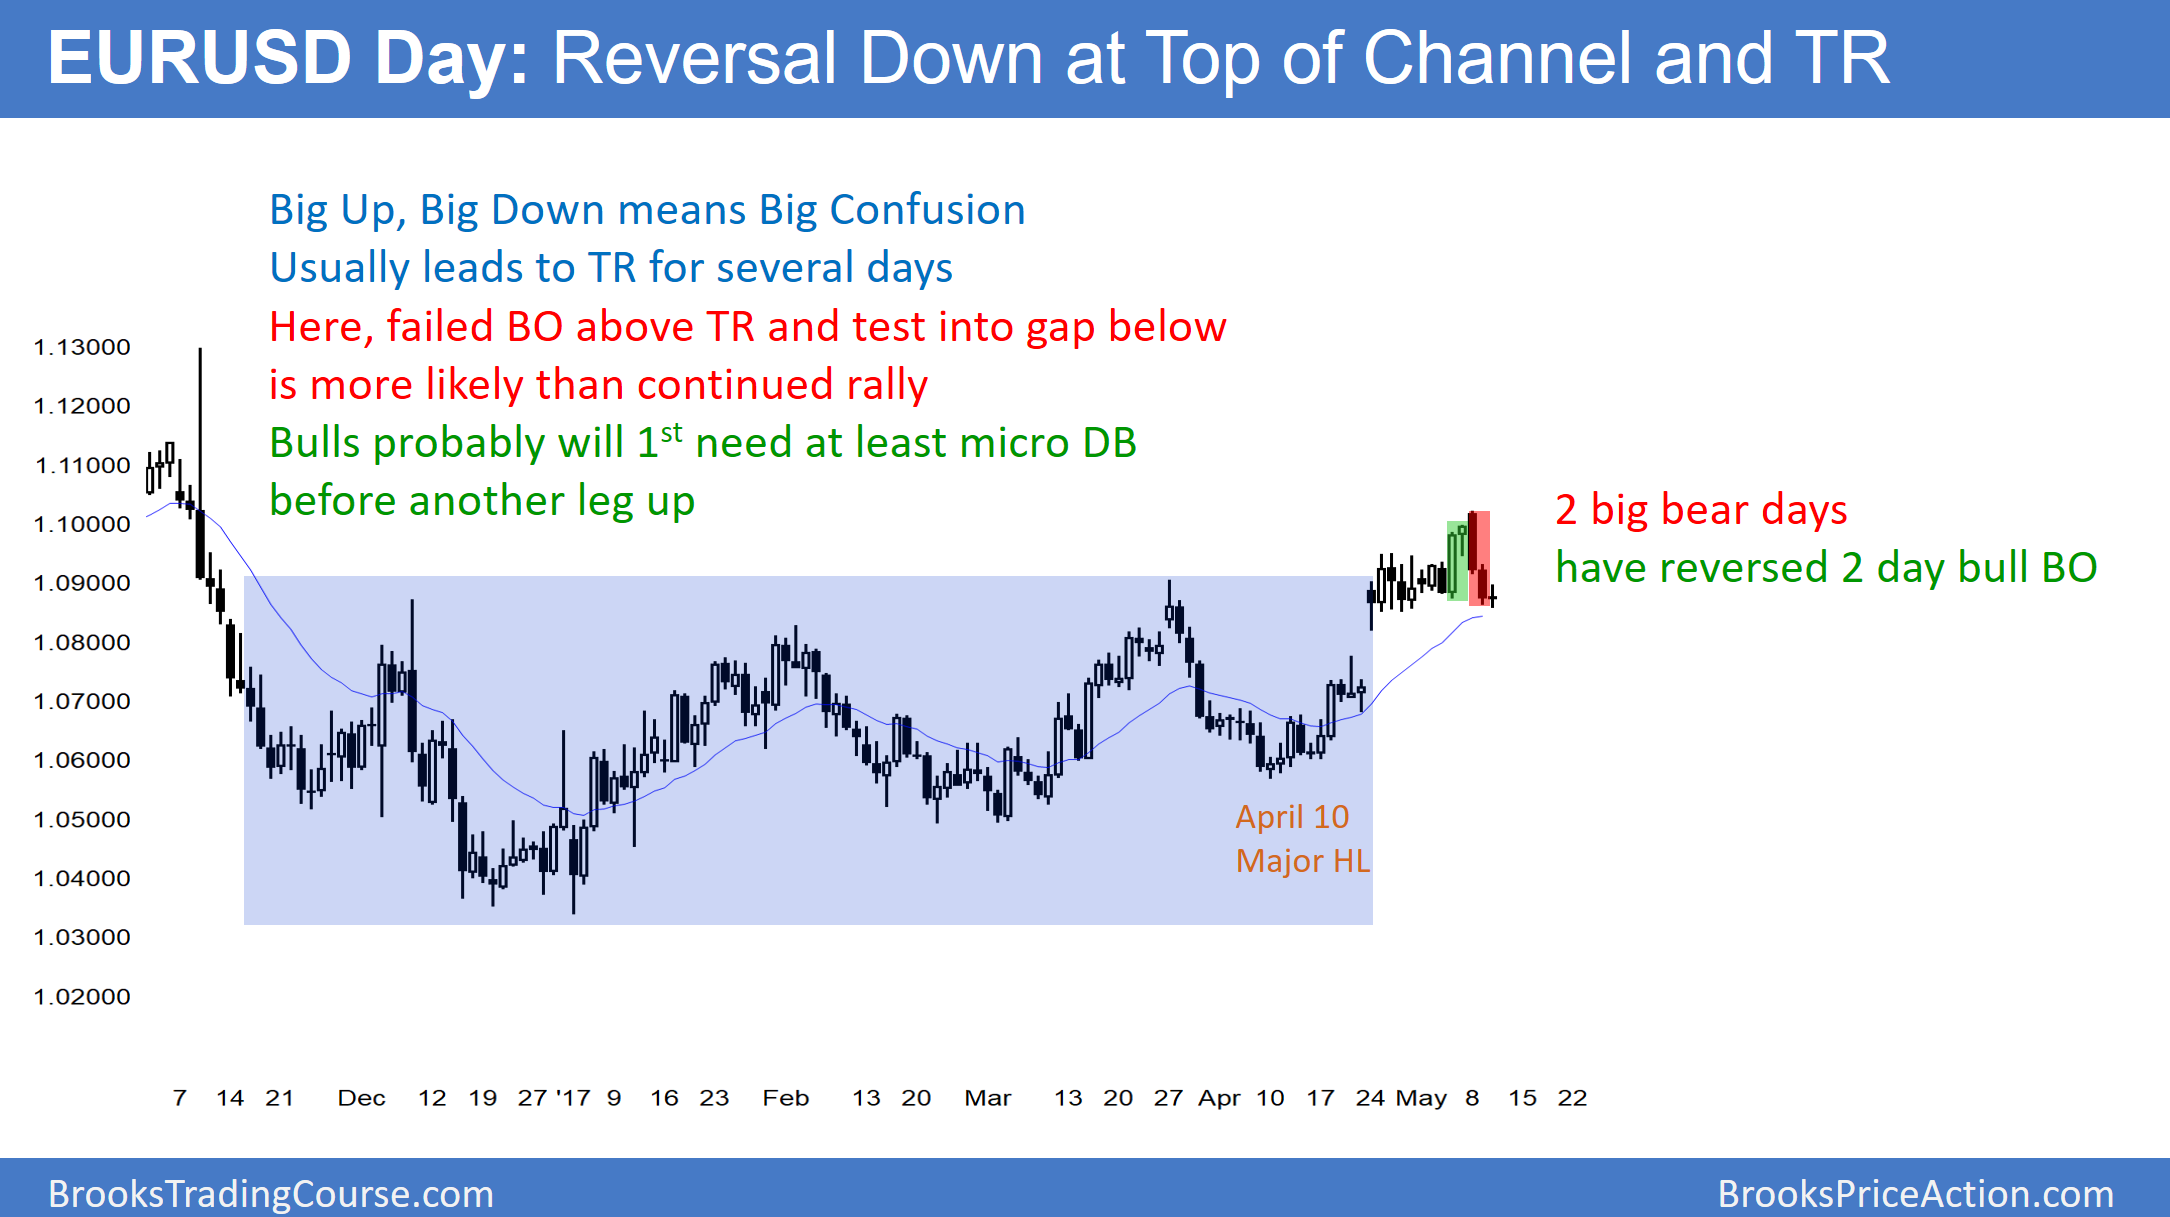
The daily EUR/USD reversed down this week. Because it is still within its 3-week trading range, the bulls see the reversal as part of a bull flag.
The Big Up, Big Down pattern of the past 5 days creates Big Confusion. Since confusion is a hallmark of a trading range, the daily chart will probably go sideways for a few days. The 3-day selloff was strong enough so that traders will probably sell the 1st rally attempt. The bulls will therefore need at least a micro double bottom before they can resume the 5 week bull trend. Their next target is a strong break above last week’s high. Additionally, they want to test the November 9 top of the strong bear reversal.
Yet, even if they are successful, the rally would still be simply another leg in the 2-year range. There is no evidence that either the bulls or bears will break out of that range anytime soon.
The reversal down has found support at the bottom of the 3-week range. Unless the bears can break strongly below the range, the odds still favor the bulls over the next week or two. Yet, the 5-week rally is a breakout about a 6 month trading range. Since most breakouts fail, the odds still favor this rally being just another leg in the 6-month range. Consequently, the bears will probably create a swing down within a couple of weeks.
Overnight EUR/USD
The EUR/USD Forex market has been in a 20 pip range for the past 4 hours. Additionally, it is testing the bottom of the 3-week trading range. Since the 3-day selloff has been in a tight bear channel on the 240-minute chart, the 1st reversal up will probably be minor. Traders will therefore sell a 1 – 3 day rally that retraces about 50% of the 3-day selloff. Consequently, the 1st 50 – 70 pip rally will probably form a lower high and lead to another test down to the bottom of the 3-week range.
Because the 3-day selloff stopped overnight at the bottom of the 3-week range, the odds favor a bounce to around the April 26 lower high in the middle of the range. This would be a 70 – 100 pip rally. In addition, it would be a 50% pullback from the 3 day selloff. Traders will sell that rally for another test down to the bottom of the 3-day range.
At that point, the bears would see a head and shoulders top on the 240-minute chart. The bulls would see a triangle or double bottom bull flag. The chart would therefore again be in breakout mode.

