In recent trading the pair has found support at 1.30043. Currently the bullish target is 1.30516; if there is a break lower through support the 38.2% line becomes the target.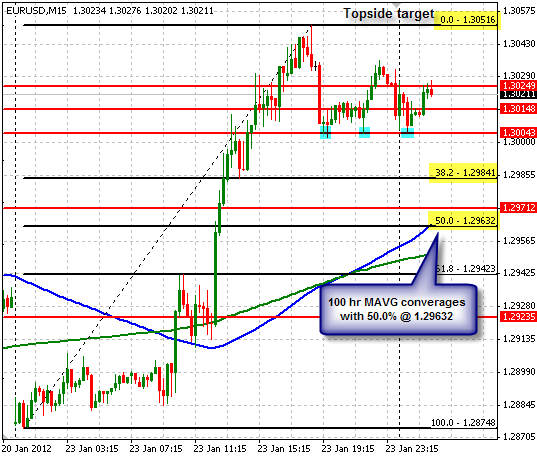 EUR/USD M15" title="EUR/USD M15" width="537" height="457">
USD/CNH testing resistance from 200 hour moving average
The Hong Kong Monetary Authority added CNH denominated government bonds to it’s list of products it requires banks to hold deposits in. Analysts are saying it appears that policy makers are sending signals that they want to grow the CNH market.
From an hourly perspective, the pair is testing resistance from the 200 hour moving average. If it holds, we look lower to possible support at 6.29676; 6.30620 to the topside.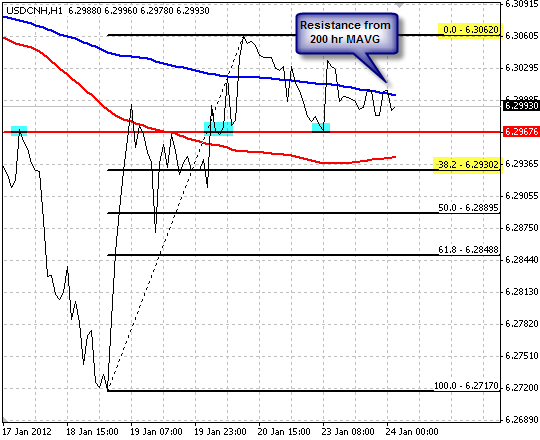
USDHKD Hourly
The USDHKD hourly chart below shows the pair could retest the short-term trendline resistance and the 100hr mavg in short order despite the holiday week in the far east.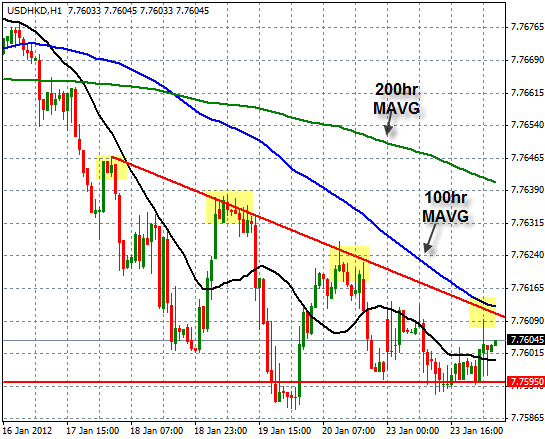 USD/HKD H1" title="USD/HKD H1" width="545" height="439">
USDSGD Daily
The USDSGD pair is hovering around the 61.8% retracement. The USD sell off to start the new year could be short-lived and the pair could rally back to what was trendline support. A break lower quickly brings the 200day mavg in play.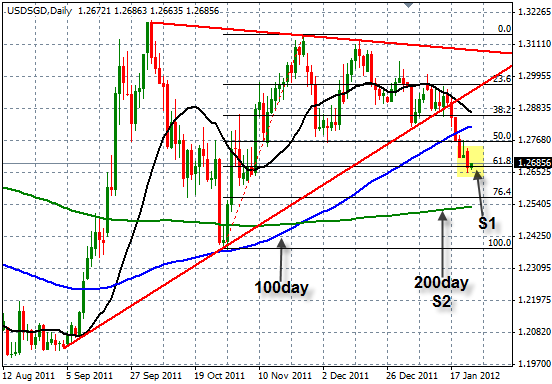 USD/SGD" title="USD/SGD" width="552" height="384">
USD/SGD looking to rebound
The dollar looks like the dollar is trying to re-gain strength after giving up group across the board during the New York trading day. In the case of the dollar versus the SGD, the pair is trading off the low of 1.26528. We see there is a downward channel developing since last week; a close above the resistance line could signal further bullish trading in which case we look to the 100 hour moving average as the first target with the 38.2% as the next. If resistance holds, we look back to the 0.0% line.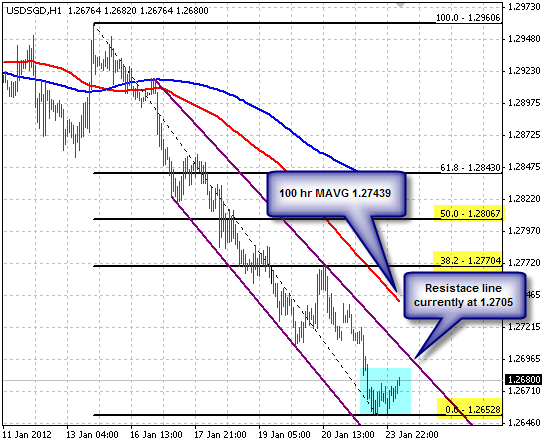 USD/SGD H1" title="USD/SGD H1" width="542" height="443">
- English (UK)
- English (India)
- English (Canada)
- English (Australia)
- English (South Africa)
- English (Philippines)
- English (Nigeria)
- Deutsch
- Español (España)
- Español (México)
- Français
- Italiano
- Nederlands
- Português (Portugal)
- Polski
- Português (Brasil)
- Русский
- Türkçe
- العربية
- Ελληνικά
- Svenska
- Suomi
- עברית
- 日本語
- 한국어
- 简体中文
- 繁體中文
- Bahasa Indonesia
- Bahasa Melayu
- ไทย
- Tiếng Việt
- हिंदी
EUR/USD Support @ 1.30043
Latest comments
Loading next article…
Install Our App
Risk Disclosure: Trading in financial instruments and/or cryptocurrencies involves high risks including the risk of losing some, or all, of your investment amount, and may not be suitable for all investors. Prices of cryptocurrencies are extremely volatile and may be affected by external factors such as financial, regulatory or political events. Trading on margin increases the financial risks.
Before deciding to trade in financial instrument or cryptocurrencies you should be fully informed of the risks and costs associated with trading the financial markets, carefully consider your investment objectives, level of experience, and risk appetite, and seek professional advice where needed.
Fusion Media would like to remind you that the data contained in this website is not necessarily real-time nor accurate. The data and prices on the website are not necessarily provided by any market or exchange, but may be provided by market makers, and so prices may not be accurate and may differ from the actual price at any given market, meaning prices are indicative and not appropriate for trading purposes. Fusion Media and any provider of the data contained in this website will not accept liability for any loss or damage as a result of your trading, or your reliance on the information contained within this website.
It is prohibited to use, store, reproduce, display, modify, transmit or distribute the data contained in this website without the explicit prior written permission of Fusion Media and/or the data provider. All intellectual property rights are reserved by the providers and/or the exchange providing the data contained in this website.
Fusion Media may be compensated by the advertisers that appear on the website, based on your interaction with the advertisements or advertisers.
© 2007-2025 - Fusion Media Limited. All Rights Reserved.
